Stellar Furnace
ANEUTRONIC DENSE PLASMA FOCUS FUSION

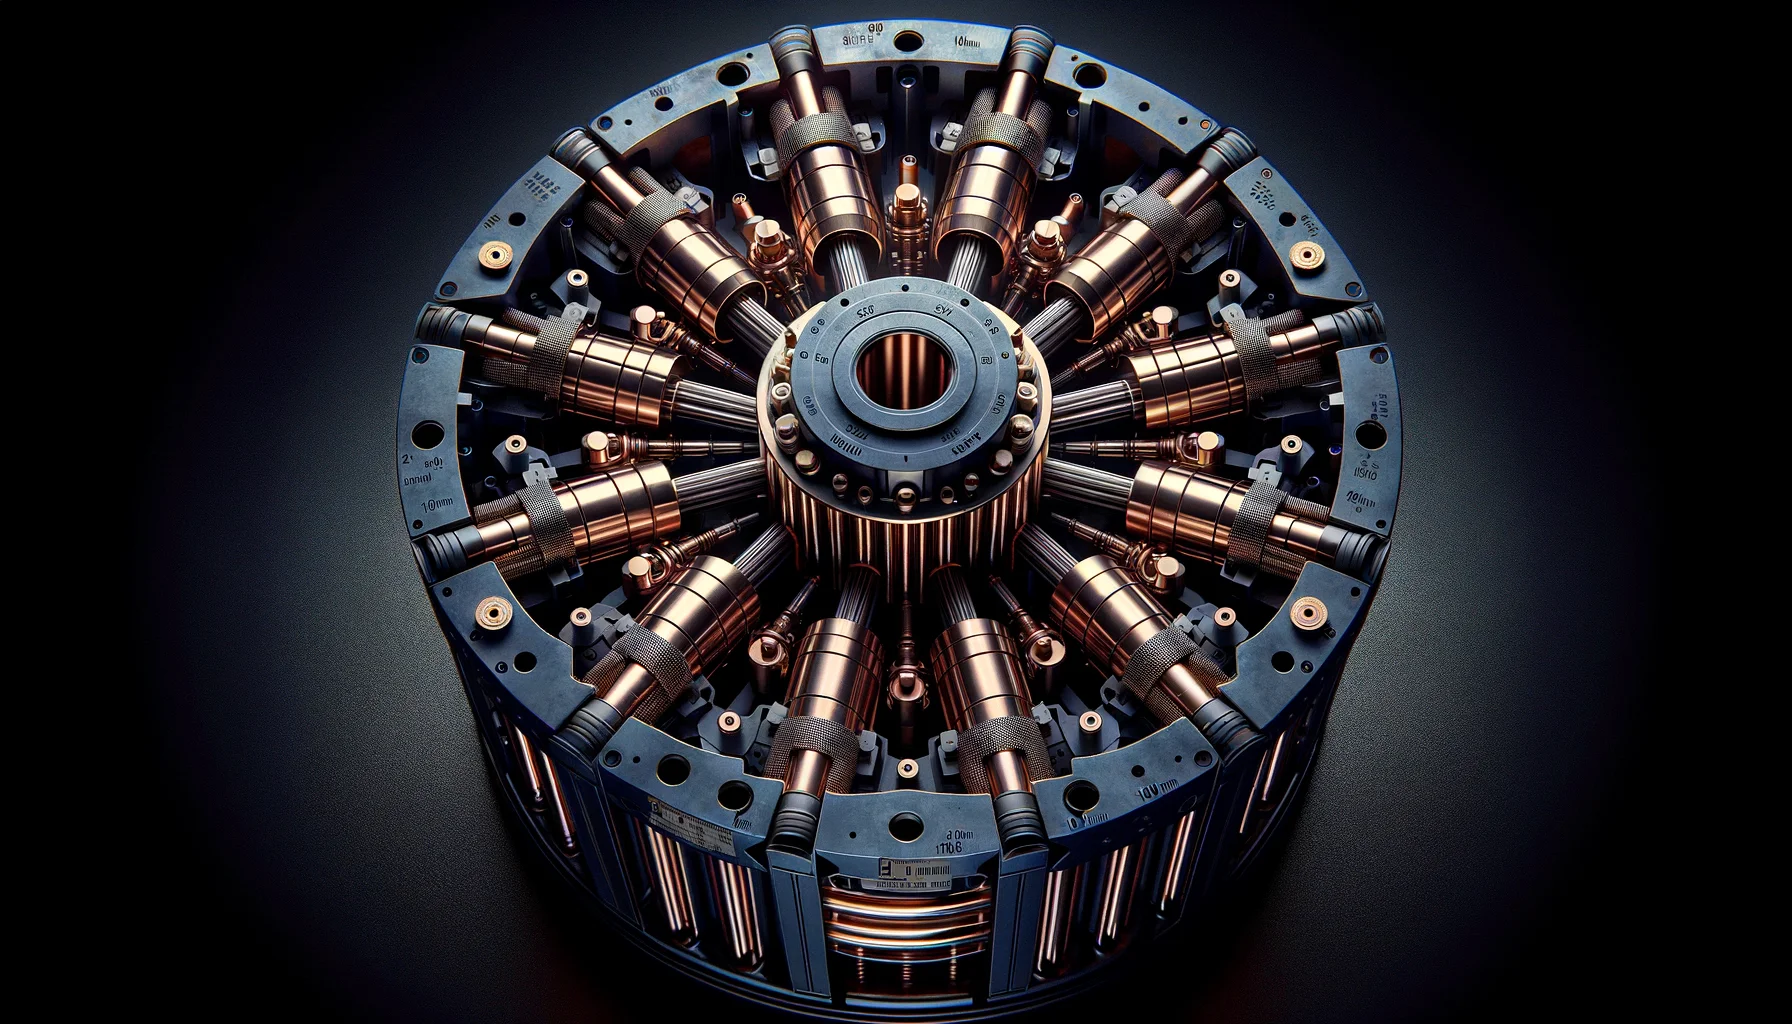
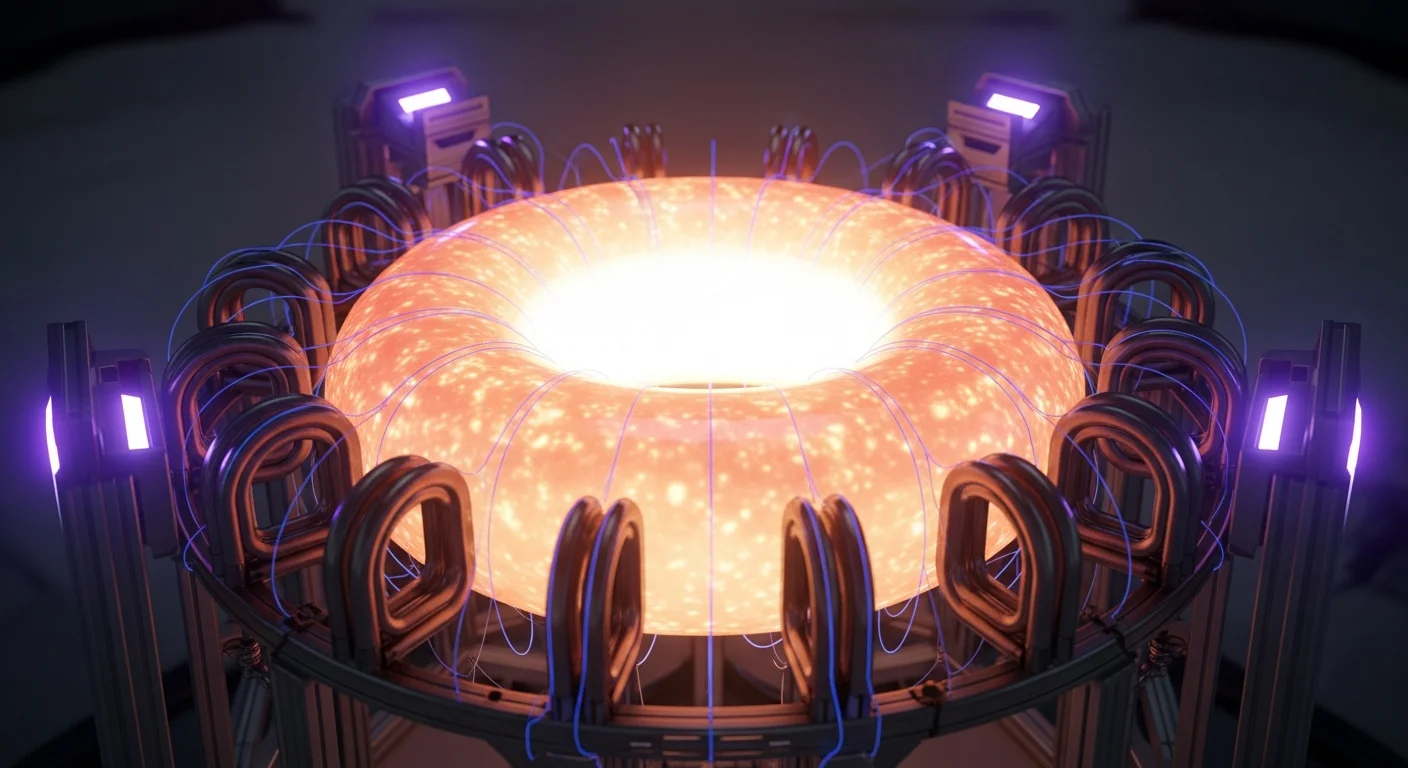
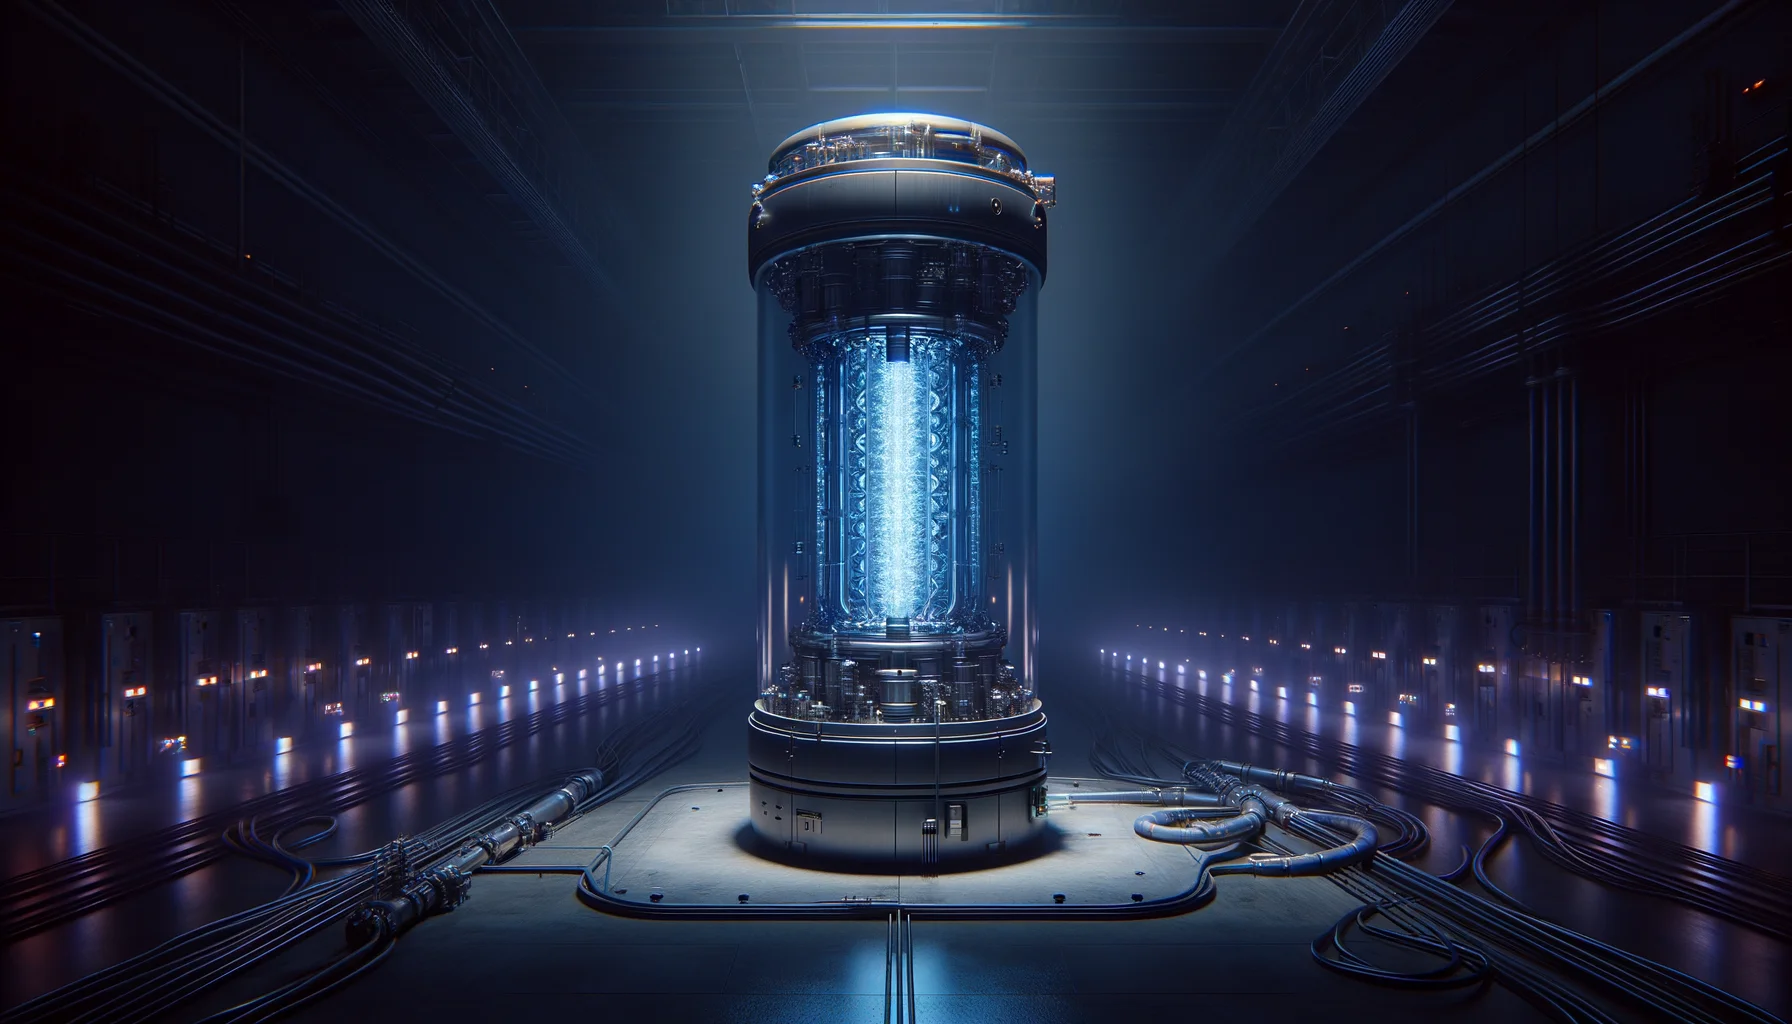
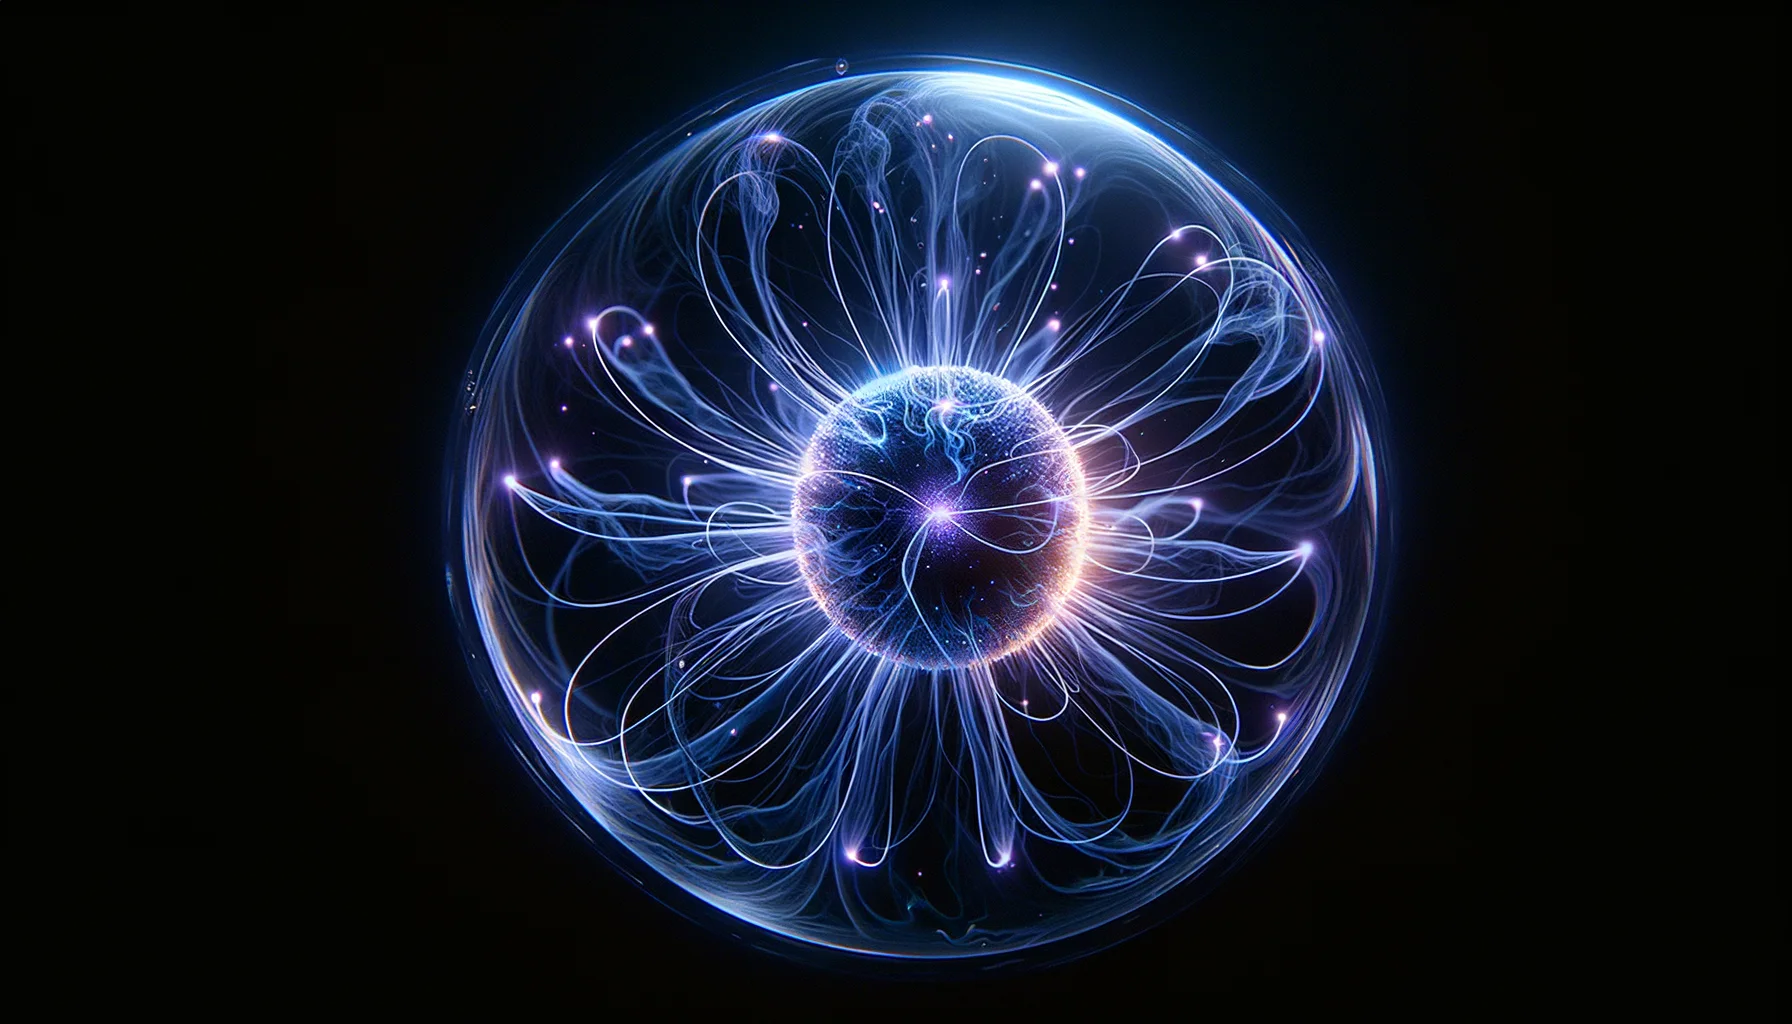
FIG 1.0: THE SF-1 DENSE PLASMA FOCUS CORE
01 // THE DIVISION
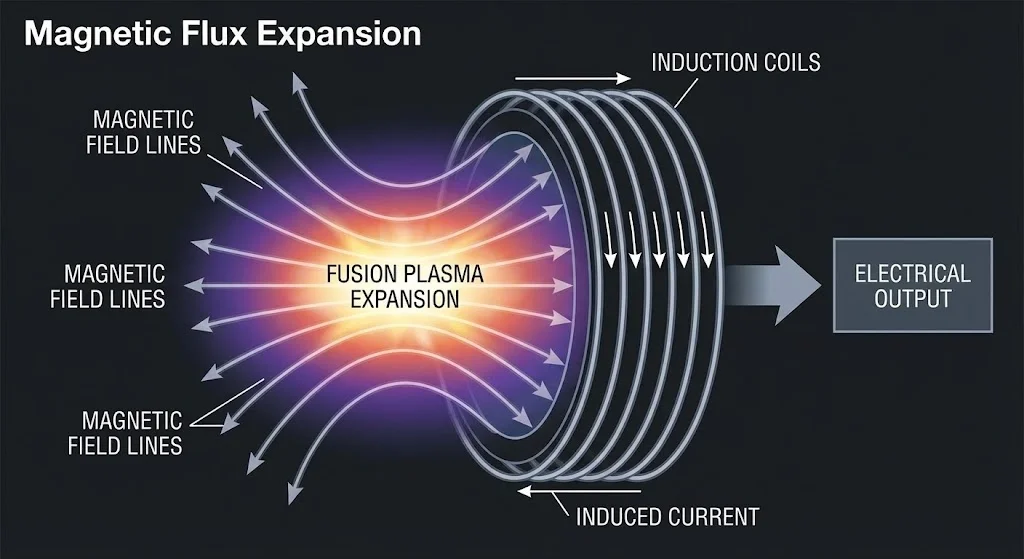
FLUX HARVEST
Stellar Furnace is the fusion energy division of Stellar Furnace. Its mission is the development and deployment of aneutronic fusion reactors based on the Dense Plasma Focus geometry, burning proton-boron fuel with direct energy conversion to electricity. The primary product under development is the SF-1 — a compact, pulsed fusion reactor producing forty megawatts of net electrical output from a device eight meters long and one meter in diameter.
The SF-1 does not boil water. It does not rotate a turbine. It does not produce neutron radiation, radioactive waste, or carbon emissions. The fuel — hydrogen and boron — is available in effectively unlimited supply from ordinary industrial sources. The waste stream is helium gas, released to atmosphere. A single annual delivery of fuel, carried in a briefcase, sustains twelve months of continuous operation.
The physics that makes this possible has been understood since 1978. The engineering that achieves it is the subject of this document.
02 // THE MACHINE
The Dense Plasma Focus is a pulsed device that compresses fuel to fusion conditions in microseconds. Two coaxial cylindrical electrodes — an inner anode and an outer cathode cage — are separated by a ceramic insulator at the breech and open at the muzzle. A capacitor bank discharges into the electrode gap, ionizing the fill gas and forming a current sheet that accelerates axially toward the open end at eighty kilometers per second. When the sheet reaches the muzzle, it transitions from axial to radial motion, collapsing inward under its own magnetic pressure. The compression is self-reinforcing: smaller radius means stronger field means faster collapse.
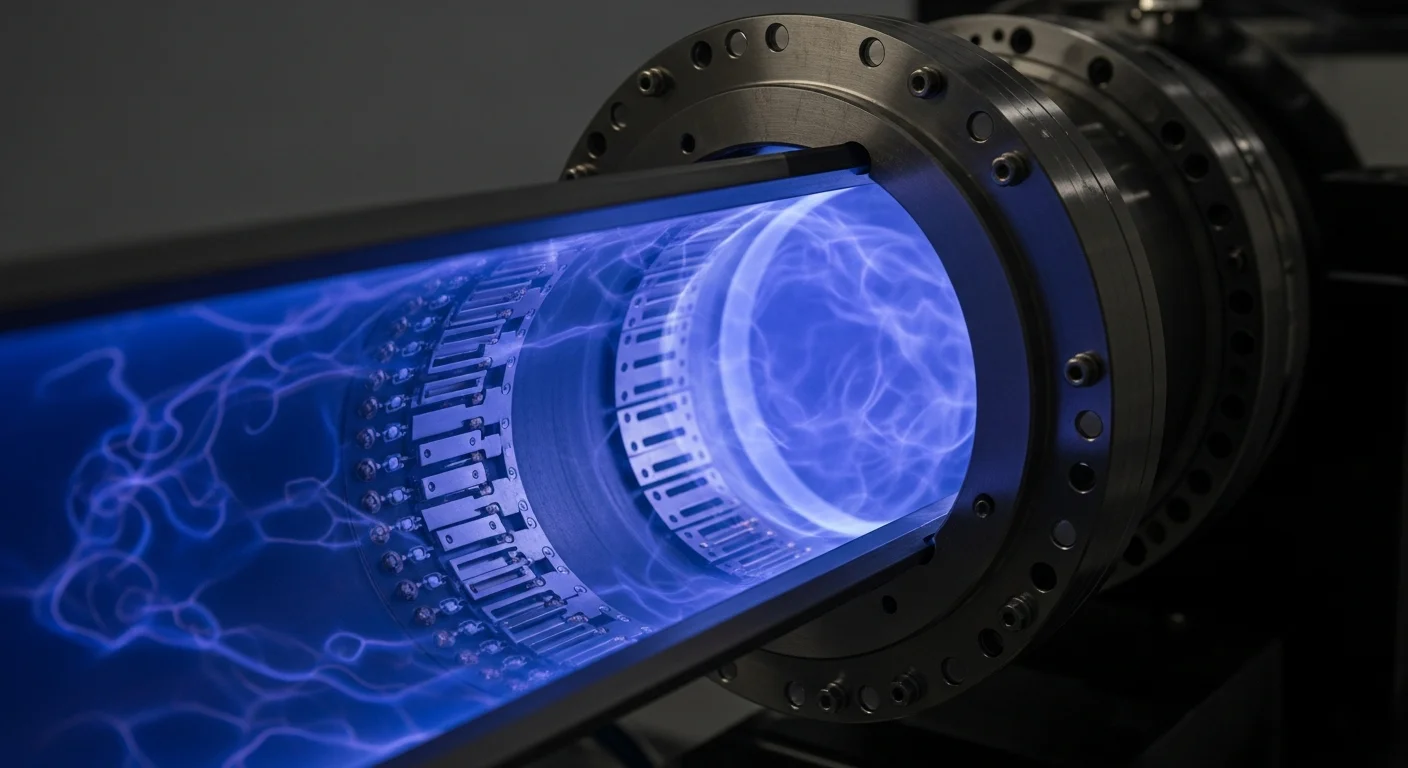
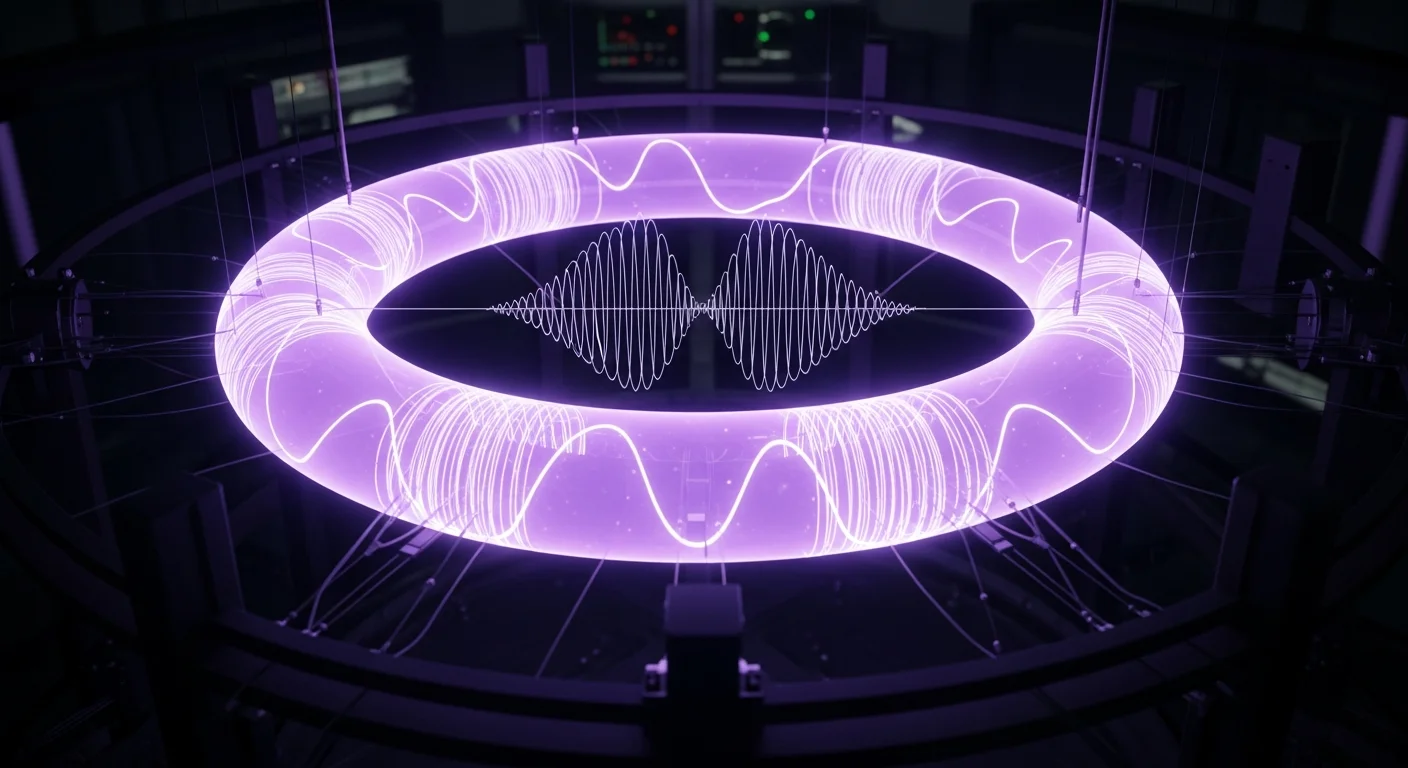
At maximum compression, the plasma column fragments into plasmoids — dense, self-confined magnetic structures at 1020–1022 cm−3 density. Inside these plasmoids, protons are accelerated to megaelectronvolt energies by the electromagnetic dynamics of the pinch instability itself — not through thermal equilibrium, but through coherent beam formation. These beam protons sit precisely in the Gamow window for p-11B fusion.
The DPF was invented in 1954. It has been operating in laboratories worldwide for seven decades. What the mainstream fusion program missed, and what Stellar Furnace did not, is that the DPF was always the p-11B machine. It produces the non-thermal beam energies that aneutronic fusion requires and that no tokamak can replicate. It just took forty years to realize it.
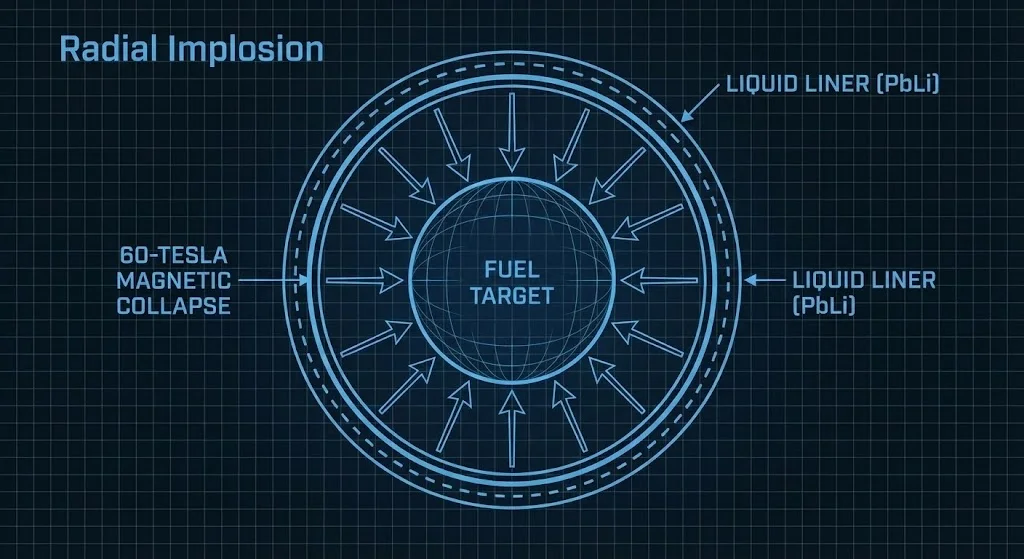
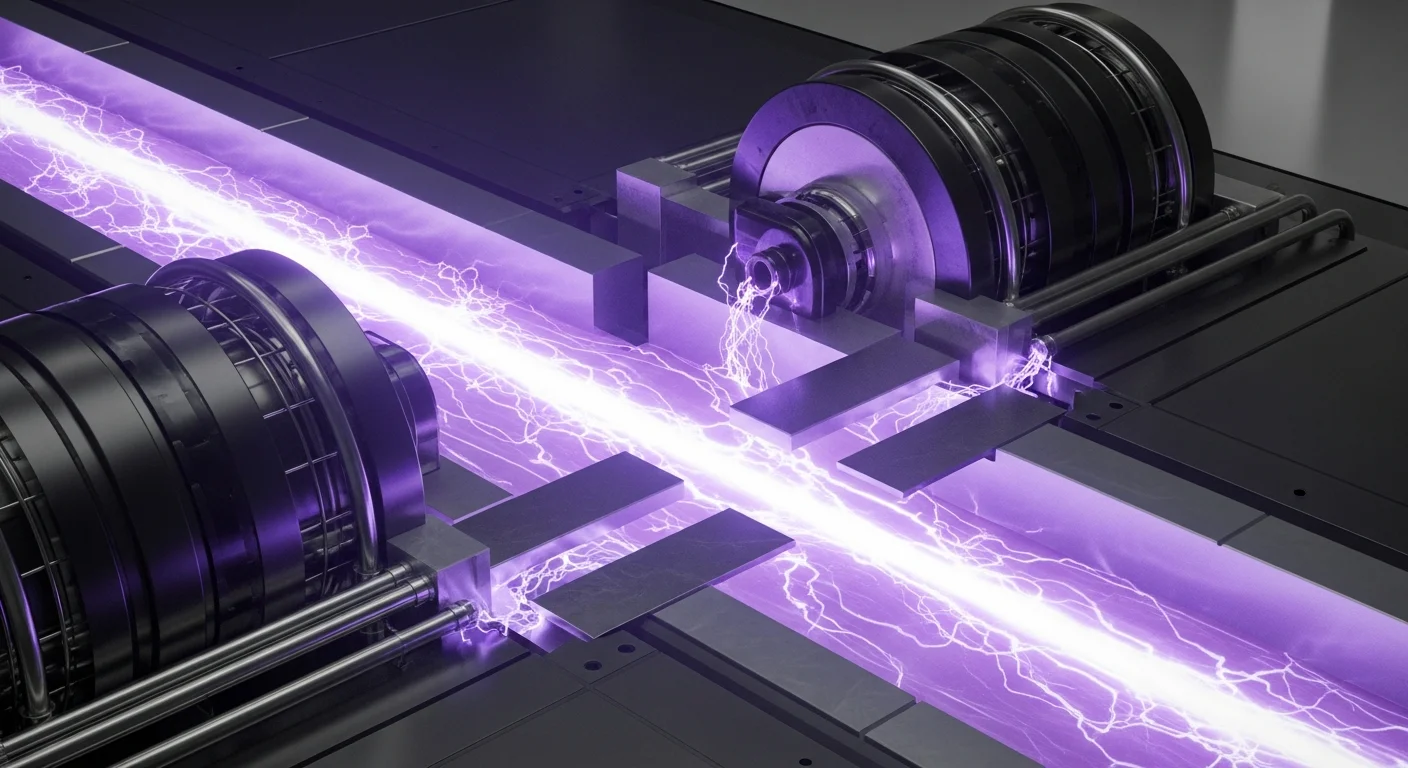
FIG 2.0: RADIAL FLUX COMPRESSION
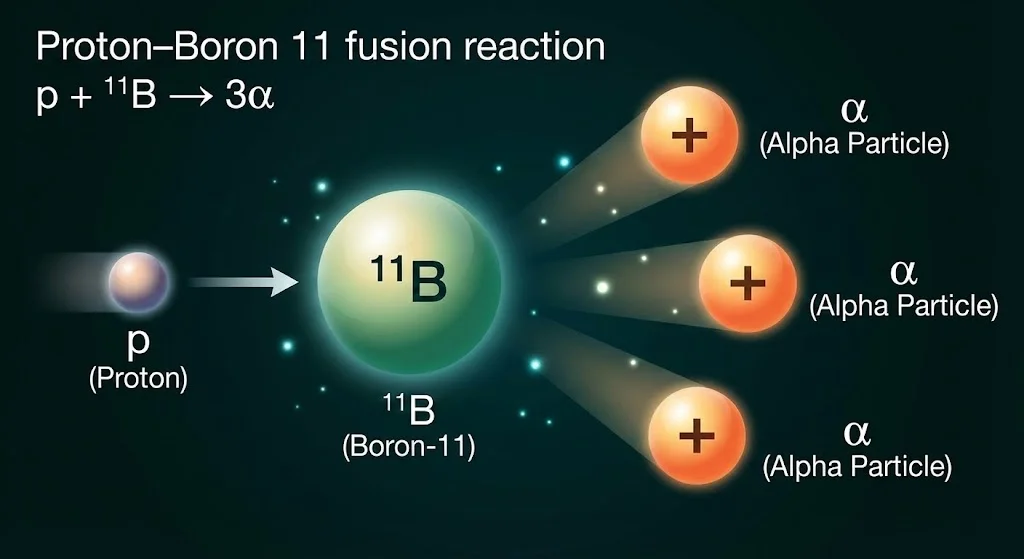
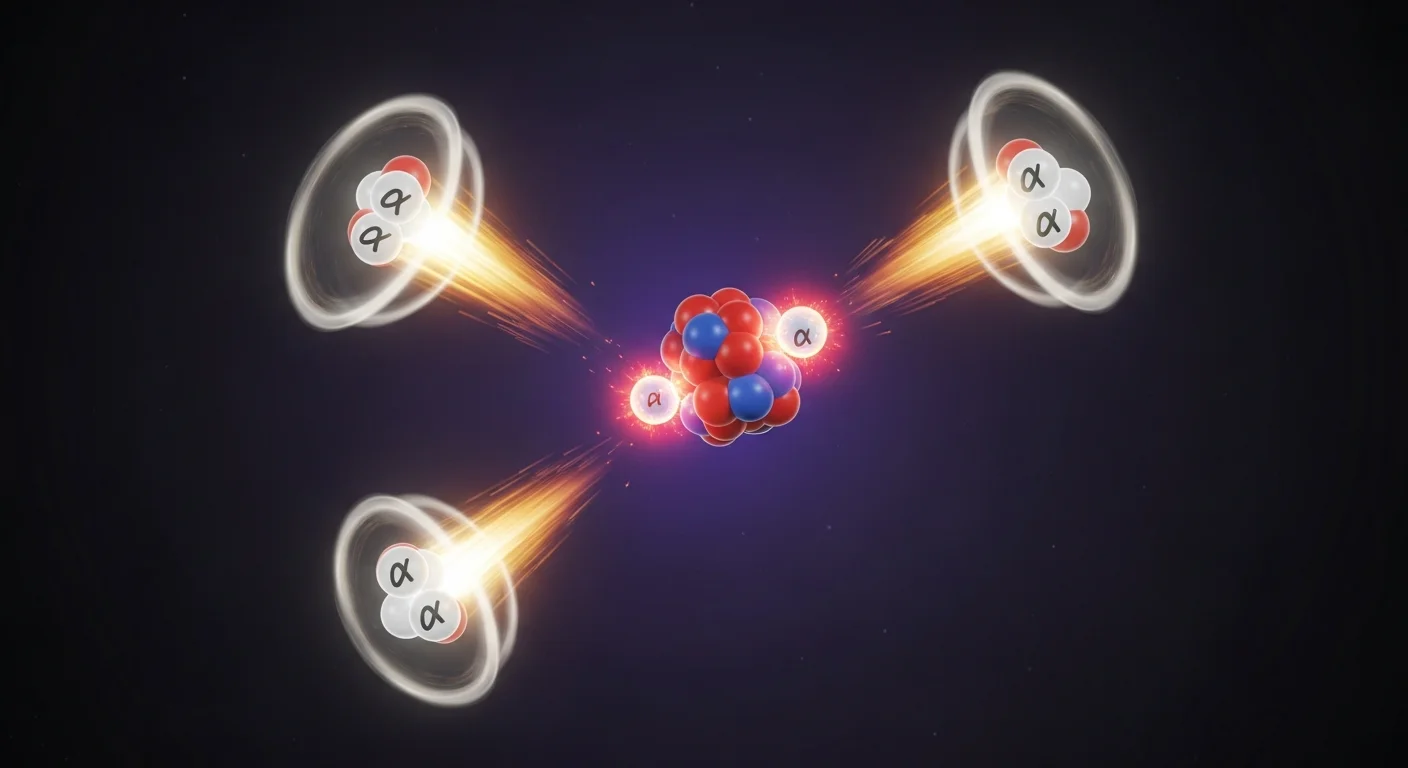
FIG 3.0: ANEUTRONIC FUSION PRODUCTS
03 // THE FUEL
KUGELBLITZ
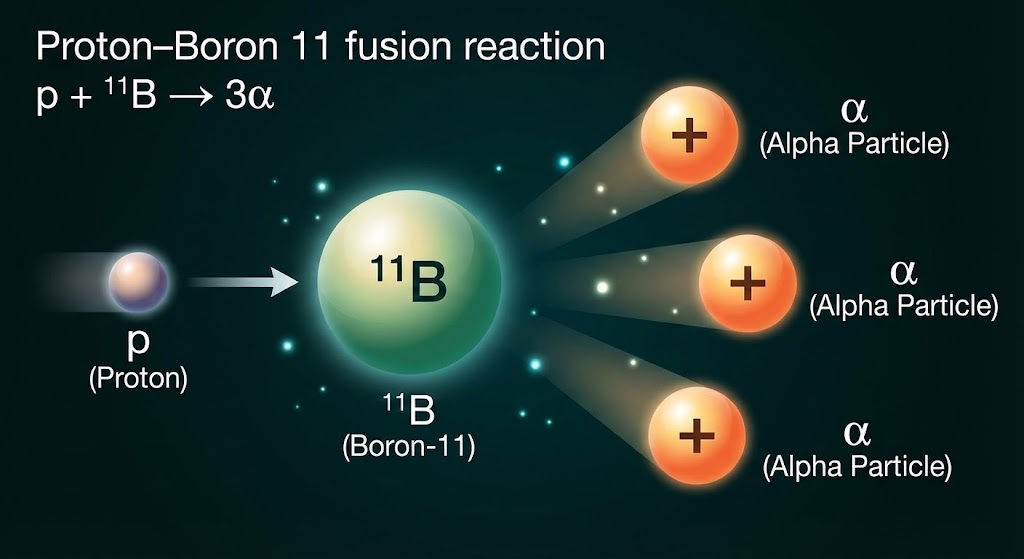
The SF-1 burns the reaction p + 11B → 3α + 8.7 MeV. A proton collides with a boron-11 nucleus at sufficient energy to overcome the Coulomb barrier, forming an unstable carbon-12 intermediate that immediately disintegrates into three helium-4 nuclei — alpha particles — each carrying millions of electronvolts of kinetic energy.
No neutrons. No radioactive waste. No radioactive byproducts of any kind. The fuel goes in as hydrogen and boron. The products come out as helium — the same inert gas that fills party balloons and lifts weather instruments into the stratosphere.
Because the output is charged particles rather than neutrons, the energy can be captured directly as electrical current through a traveling-wave deceleration architecture, bypassing the steam turbine entirely. The SF-1 targets 65–75% direct conversion efficiency — roughly double the Carnot-limited efficiency of any thermal cycle.
Hydrogen requires no discussion. Boron-11 constitutes 80% of natural boron, is the fifth most abundant element in Earth's crust, and is available from seawater at concentrations representing billions of years of supply. The annual fuel consumption of one SF-1: approximately 10 kg of hydrogen and 110 kg of enriched boron-11. A single briefcase delivery per year.
04 // THE HARVEST
LATTICE CONFINEMENT
The SF-1 fires fifty thousand pulses per second. Each pulse compresses fuel to fusion conditions in one hundred nanoseconds, produces a burst of alpha particles, and disperses. The alpha particles — spanning 0.5 to 8 MeV — are directed by a magnetic mirror into a twenty-four-stage traveling-wave direct converter that decelerates them against a spatially varying electric potential, extracting their kinetic energy as electrical current.
A secondary organic Rankine cycle recovers thermal energy from the bremsstrahlung recapture shell — a beryllium-lithium composite that absorbs X-ray radiation from the plasma and converts it to usable heat. The combined electrical output: 40 MW net after recirculating power and auxiliary loads.
The physical dimensions that contain this power flow: 8.8 meters long, 1.0 meter diameter, 2,800 kilograms. The gross fusion power density — 187 MW/m³ — is seven hundred thousand times the power density of the solar core.
05 // THE DEVELOPMENT TIERS
The program is staged across four fusion fuel cycles, each progressively harder to ignite but with progressively better output characteristics. Tier 1 uses proven physics. Tier 4 is a long-term research target.
Fuel: Deuterium + Tritium. Ignition: ~100M K. Proven physics with the highest cross-section.
Limitation: 14.1 MeV neutron output requires shielding and periodic first-wall replacement using Metallic Sciences remote handling.
Fuel: D-He3 or He3-He3. Dramatically reduced neutron output.
Fuel supply constraint: terrestrial He-3 is scarce. Viable only with space-based supply chain (Lorentz Aerospace).
Fuel: p + 11B → 3α + 8.7 MeV. Zero primary neutron output. All energy carried by charged alpha particles.
The hardest ignition threshold of any practical fusion fuel. Whether the DPF can achieve net energy at p-B11 conditions is the central question this program exists to answer.
Fuel: Fusion target + antiproton beam from Antimatter Production.
Long-term research concept. Depends on antiproton storage densities that do not currently exist. Application: propulsion for Lorentz Aerospace. Theoretical only.
06 // TARGET FORM FACTORS
Three deployment configurations, contingent on successful development of the SF-1 core:
01 — "THE CAMPFIRE" (COMPACT REACTOR)
40 MW net electrical. DPF core ~8.8 m length; balance-of-plant ~900 m².
Target: remote industrial sites, military installations, data centers.
Inherently fail-safe: loss of confinement terminates the reaction passively.
02 — "THE FURNACE" (MULTI-UNIT INSTALLATION)
Multiple SF-1 units in parallel for GW-class output. Dedicated industrial campus.
Target: Metallic Sciences smelters, heavy industrial process heat, grid-scale baseload.
Long-term target. Scaling raises engineering challenges beyond current program scope.
03 — "THE NOVA" (PROPULSION CORE)
Variable thrust via magnetic nozzle exhaust. Open one end of the DPF confinement geometry.
Target: Lorentz Aerospace propulsion systems.
Long-term research target requiring successful SF-1 core development plus magnetic nozzle qualification.
07 // SUPPLY CHAIN — DIVISION INTEGRATION
The SF-1 is the integration point for components produced across seven Stellar Furnace divisions. The supply chain is the competitive moat. No external supplier can replicate the SF-1 because no external supplier commands the full stack of enabling technology.
Highfield Magnetics REBCO superconducting coils — mirror coils at 8 T, guide field solenoid, staged compression coils. ~50 km of tape per SF-1.
Metallic Sciences triazite W-Re-HfC alloy for anode tip inserts. Beryllium-lithium converter shell by HIP. OFC copper electrode bodies.
Vapor Vacuum pulls the chamber to 10−9 Torr and provides the differential pumping manifold for helium ash removal at 50 kHz.
Phase Flash cryogenic systems maintaining four superconducting coil systems at 20 K plus anode cooling at 77 K. Total cryogenic input: ~18 kW.
Aetheric Sciences Monolith control processor — CMA-ES shot-to-shot optimization at 50 kHz, neural surrogate with 14 ns forward pass, 5 μs total control latency.
Plasma Press machines the electrode assembly to ±0.05 mm concentricity and the 120 De Laval micro-nozzles of the gas injection ring.
Foundation Kinetics Scarab micro-robots install the 24 converter electrode stages and perform beryllium shell replacement under hot-cell conditions.
08 // PROGRAM SUMMARY
The SF-1 program targets aneutronic fusion power from a compact Dense Plasma Focus reactor, using proton-boron fuel and direct energy conversion. The physics has been understood for decades. The engineering gap is real, quantifiable, and addressed by a staged development program.
FUEL — Hydrogen + Boron-11. Abundant. Non-radioactive. No enrichment beyond isotope separation.
SAFETY — Inherently fail-safe. Loss of confinement terminates the reaction passively. No meltdown pathway.
OUTPUT — Charged alpha particles. Direct conversion to electricity. Negligible neutron flux.
WASTE — Helium gas. Released to atmosphere. Regulatory classification: air.
TIMELINE — Three-stage program. $1.92B total. Eight years to first grid-connected SF-1.
The full technical derivation, from Coulomb barrier to grid connection, is presented in the white paper below.
09 // VACUUM ENERGY DENSITY AS ENGINEERING RESOURCE
The quantum vacuum is not empty. It is a seething field of virtual particle pairs, electromagnetic zero-point fluctuations, and Casimir-force gradients that represent the densest energy reservoir in the known universe. The question is not whether this energy exists — it is experimentally confirmed, measured to five significant figures via the Casimir effect — but whether it can be extracted and converted to useful work at rates sufficient for engineering application.
Stellar Furnace’s interest is specific: the SF-1 Dense Plasma Focus column operates at energy densities approaching 1014 J/m³ during peak compression. At these densities the electromagnetic stress-energy of the plasma is no longer negligible relative to the vacuum energy background. The plasma column does not merely exist in the vacuum — it couples to it. Zero-point field interactions become a measurable perturbation on confinement dynamics, energy balance, and alpha-particle trajectories.
The research programme, conducted jointly with Vapor Vacuum’s quantum metrology group, investigates three questions:
1. Casimir-enhanced confinement. Can nano-structured cavity boundaries inside the DPF electrode geometry modify the local vacuum energy density to create additional inward pressure on the pinch column? Theoretical models suggest a ~0.1% enhancement at current geometries, scaling with electrode surface area and cavity Q-factor.
2. Vacuum energy extraction via parametric down-conversion. Rapid modulation of a resonant cavity boundary (at GHz rates using Maxwell Continuum piezoelectric actuators) can convert virtual photons into real photon pairs. The energy is extracted from the vacuum field itself. Current laboratory demonstrations yield picowatt-scale output. Scaling to useful power requires cavity Q-factors exceeding 109, achievable in superconducting microwave resonators.
3. Dynamic Casimir effect as diagnostic. Even if vacuum energy extraction remains impractical for power generation, the dynamic Casimir effect provides a high-sensitivity diagnostic for the extreme electromagnetic conditions inside the SF-1 pinch column. Real photon production from the oscillating plasma boundary gives a direct measurement of field gradient magnitudes that are otherwise inaccessible to conventional diagnostics.
This programme is pre-commercial. No vacuum energy extraction system is on the SF-1 product roadmap. Its value to the fusion programme is diagnostic and theoretical: understanding the vacuum coupling improves our models of what happens in the last microsecond before peak compression, where the physics is least understood and the energy densities are highest.
10 // LATTICE-CONFINED NUCLEAR REACTIONS
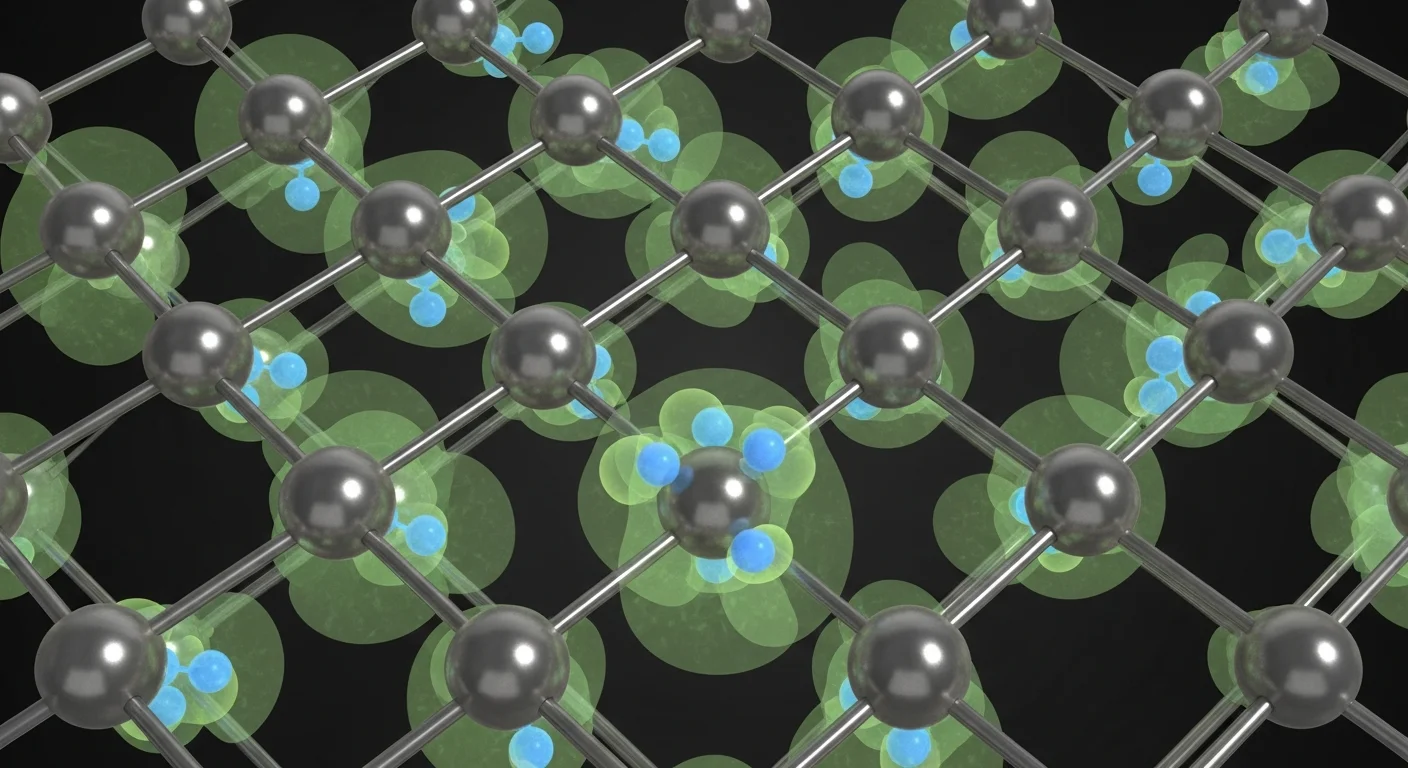
In parallel with the Dense Plasma Focus programme, Stellar Furnace maintains a small research effort on lattice-confined nuclear reactions (LCNR) — the phenomenon formerly and controversially known as “cold fusion.” The terminology matters: LCNR describes nuclear reactions occurring within a metal lattice at energies far below the Coulomb barrier, mediated by lattice phonon coupling and electron screening effects that are absent in free-space plasma. It is not the same physics as the SF-1. It may be complementary.
The experimental basis is now substantial. NASA Langley Research Center published peer-reviewed results (Widom-Larsen theory, validated by Lattice Energy LLC) demonstrating that heavy-electron capture by protons in a palladium-deuterium lattice produces ultra-low-momentum neutrons — neutrons with de Broglie wavelengths comparable to the lattice spacing, enabling nuclear transmutation at room temperature without the energetic neutron flux that characterises conventional fusion. The process is exothermic. The excess heat is real, reproducible, and has been measured by multiple independent laboratories.
Stellar Furnace’s LCNR programme focuses on three areas:
Lattice loading optimisation. Using Metallic Sciences single-crystal palladium substrates with controlled defect density to achieve deuterium loading ratios above 0.9 (the threshold above which excess heat is consistently observed). Electrochemical loading, gas-phase loading, and ion-beam implantation are all under investigation.
Calorimetry at scale. The historical controversy around LCNR was largely a calorimetry controversy — were the excess heat measurements real or artefactual? Modern flow calorimetry with calibrated Joule heating references resolves this question definitively. Our calorimetry rig, built by Phase Flash, measures thermal output to ±50 mW over 1,000-hour continuous runs.
Neutron detection. If Widom-Larsen theory is correct, ultra-low-momentum neutrons are produced during lattice-confined reactions but are immediately captured by nearby nuclei, producing no detectable neutron flux outside the lattice. We are developing boron-10 neutron absorber arrays integrated directly into the palladium lattice structure to detect these neutrons in situ — a measurement that has never been achieved.
LCNR, if scalable, would represent a fundamentally different energy source from the SF-1: low-temperature, solid-state, and intrinsically safe. It would not replace the DPF for high-power-density applications (propulsion, industrial heat). It could replace it for distributed low-power applications — building heat, remote sensors, space probes — where the SF-1’s complexity is disproportionate to the power requirement.
ENGINEERING THE STAR
A TECHNICAL WHITE PAPER ON ANEUTRONIC FUSION POWER
STELLAR FURNACE — AN INDEPENDENT COMPANY
Prologue
The Fire That Powers Everything

There is a moment, approximately four seconds into the SF-1 startup sequence, when the plasma in the pinch column reaches one billion Kelvin.
Not a million. Not ten million — the temperature at the core of the Sun, the temperature that drives the deuterium-tritium reactions in every conventional fusion program on Earth. One billion Kelvin. A hundred times hotter than the center of the Sun. A temperature that exists nowhere in the solar system except, briefly, in the throat of the SF-1 dense plasma focus column — and in the cores of the most massive stars in the galaxy during their final hours before collapse.
At one billion Kelvin, something happens that cannot happen at any lower temperature. A proton — the nucleus of a hydrogen atom, the simplest particle in the universe — collides with a boron-11 nucleus with enough kinetic energy to overcome the electrostatic barrier that has kept them apart since the beginning of the universe. They fuse. For an instant, they become carbon-12 — an unstable intermediate that cannot hold itself together at this energy. It immediately disintegrates into three helium-4 nuclei — alpha particles — each carrying 2.9 MeV of kinetic energy, flying apart at velocities approaching three percent of the speed of light.
No neutrons. No radioactive waste. No radioactive byproducts of any kind. The fuel goes in as hydrogen and boron. The products come out as helium — the same inert gas that fills party balloons and lifts weather instruments into the stratosphere. The energy comes out as three fast-moving alpha particles whose kinetic energy can be captured directly as electrical current, with no steam turbine, no thermal cycle, no Carnot efficiency limit.
This is the reaction that powers the Stellar Furnace technology spine.
The SF-1 is not a power plant in the sense that word has carried for a hundred and fifty years. It does not burn anything. It does not boil water. It does not rotate a generator. It does not produce waste that must be stored for ten thousand years in geological repositories. It produces no carbon. It produces no radioactive material. The fuel — hydrogen and boron — is available in essentially unlimited quantity: hydrogen from water, boron from seawater at concentrations that represent billions of years of supply at any conceivable consumption rate.
The SF-1 is a box. Eight cubic meters. Twenty-eight hundred kilograms. It fits in a large SUV’s footprint. It produces forty megawatts of continuous electrical output — enough to power thirty thousand homes, or one XR-1 plasma bubble craft in full-thrust operation, or one Metric Infrastructure terminal hub with enough margin to run the entire building around it.
It runs on a kilogram of fuel per year.
It does not require refueling in the conventional sense — the fuel consumption is so low that a single delivery of hydrogen and boron powder, made once per year by a technician with a briefcase, keeps the SF-1 at full output for the following twelve months. There is no fuel logistics infrastructure. No pipeline. No tanker. No regulatory regime governing delivery of hazardous materials. Hydrogen and boron are not hazardous. They are not flammable at the concentrations used. They are not toxic. Boron is a mineral supplement sold in health food stores.
The waste stream is helium gas. It is released to atmosphere. Helium is the second most abundant element in the universe and an inert noble gas that participates in no chemical or biological reactions. The regulatory classification of the SF-1 exhaust stream is: air.
Consider what this means for the infrastructure of civilization.
Every power system currently operating on Earth — coal, gas, nuclear fission, solar, wind, hydro — requires either continuous fuel delivery, continuous weather, continuous water flow, or continuous management of radiation and waste. Every one of them requires physical infrastructure that ties the power source to a specific geography. Coal plants sit next to rail lines. Gas plants sit next to pipelines. Nuclear plants sit next to cooling water and away from populations. Solar farms require land area proportional to their output. Wind turbines require wind.
The SF-1 requires none of these things. It requires a room. Any room, anywhere on Earth — or anywhere off it. The Lorentz Aerospace XR-1 flies the SF-1 to orbital altitude and runs the plasma bubble on the same power output that a conventional power plant delivers to a small city. The Metric Infrastructure Needle terminal at a deep-space installation runs on an SF-1 that was carried there through a wormhole throat in a single transit. A submarine fleet powered by SF-1 cores has essentially unlimited range — not the ninety days of a nuclear submarine, not the weeks of a diesel boat, but indefinite endurance limited only by consumables and crew.
The implications extend beyond mobility. The SF-1 is the technology that breaks the geographic correlation between energy and civilization. For the hundred and fifty years of the industrial era, the map of economic development has tracked the map of energy resource access almost exactly. Countries with coal built industries. Countries with oil built transportation empires. Countries with neither built neither. The SF-1 makes this correlation obsolete. Energy, at SF-1 scale, becomes as locationally neutral as mathematics.
The physics that makes this possible has been known since 1978, when Friedwardt Winterberg first calculated the conditions required for proton-boron fusion in a dense plasma focus geometry. The engineering that achieves it — the specific combination of pinch geometry, fuel injection timing, magnetic field configuration, and direct energy conversion architecture — took another forty years to develop. Stellar Furnace is the first organization to close the loop between the physics and the product.
The distance between what the physics permits and what the SF-1 delivers is not zero. The gap between laboratory demonstration of p-11B fusion in dense plasma focus devices — confirmed at LPP Fusion, at the Air Force Research Laboratory, in laser-target experiments at institutions across three continents — and the SF-1’s forty megawatt continuous output is a real engineering gap. This document characterizes it honestly.
But the physics is not speculative. The p-11B reaction cross-section has been measured. The dense plasma focus pinch geometry has been operating in laboratories since 1954. Direct energy conversion of alpha particle kinetic energy to electrical current has been demonstrated at forty-eight percent efficiency at the Tandem Mirror Experiment in 1981 and at higher efficiencies in subsequent laboratory work. Every physical phenomenon the SF-1 depends on has been experimentally confirmed.
The SF-1 is an engineering problem. It is a hard engineering problem. It is the hardest engineering problem Stellar Furnace has ever worked on. It is not a physics problem. The physics is done.
This document is the engineering decomposition of the SF-1 — from the nuclear reaction at one billion Kelvin through the dense plasma focus pinch geometry, the magnetic compression and timing architecture, the direct energy conversion system, the thermal management, and the complete operational specification. It begins where all fusion physics must begin: with the question of why p-11B requires a billion Kelvin when the Sun gets by on ten million, and what that difference means for the engineering that must achieve it.
The fire is real. The star is small. The furnace is building.
Part I
The Nuclear Reaction

1.1 — Why the Sun Cannot Do This
The Sun fuses hydrogen into helium. It has been doing so for four and a half billion years and will continue for another five billion. It is the most successful fusion reactor in the solar system by any measure — longevity, total energy output, fuel efficiency. It is also extraordinarily bad at fusion by the standards of what the SF-1 requires.
The solar core operates at approximately fifteen million Kelvin. At this temperature, the proton-proton chain — the dominant fusion pathway in the Sun — proceeds at a rate so slow that an individual proton waits, on average, nine billion years before fusing with another proton. The Sun produces power not because fusion is fast but because the Sun is enormous. Its output of 3.8 × 1026 watts comes from a volume of 1.4 × 1027 cubic meters. The power density at the solar core is approximately 276 watts per cubic meter — less than a human body’s metabolic power density. A compost heap generates more power per unit volume than the center of the Sun.
The SF-1 cannot be the size of the Sun. It must produce forty megawatts from eight cubic meters — a power density of five megawatts per cubic meter, eighteen thousand times higher than the solar core. This requires a reaction rate eighteen thousand times faster than the proton-proton chain at solar temperatures. And p-11B is not the proton-proton chain — it is a reaction that does not occur at solar temperatures at all. The cross-section for p-11B fusion at fifteen million Kelvin is effectively zero. The reaction requires conditions that the Sun never reaches.
Understanding why — and what those conditions demand of the engineering — begins with the Coulomb barrier.
1.2 — The Coulomb Barrier
Two atomic nuclei approaching each other experience electrostatic repulsion proportional to the product of their charges and inversely proportional to the square of the distance between them. This is the Coulomb barrier — the energy hill that reactant nuclei must climb before they can get close enough for the strong nuclear force to take over and fusion to occur.
The height of the Coulomb barrier for two nuclei of charges Z1e and Z2e approaching to a distance r is:
For p-11B fusion, Z1 = 1 (proton) and Z2 = 5 (boron-11). The nuclear radius of boron-11 is approximately r ≈ 3.0 fm = 3.0 × 10⁻¹⁵ m — the distance at which the strong force begins to dominate. The classical Coulomb barrier height:
Twenty-eight billion Kelvin. This is the classical temperature at which a proton has enough thermal kinetic energy to surmount the Coulomb barrier and reach the boron-11 nucleus. No fusion reactor — and no star — operates at twenty-eight billion Kelvin. The classical barrier is not the actual barrier. Quantum mechanics provides a critical correction.

1.3 — Quantum Tunneling and the Gamow Window
Quantum mechanics allows particles to tunnel through barriers they do not have enough energy to surmount classically. The probability of tunneling through the Coulomb barrier for two nuclei with center-of-mass kinetic energy E is given by the Gamow factor:
where v is the relative velocity and EG is the Gamow energy:
Here mr is the reduced mass of the p-11B system, α = e2/(4πϵ0ℏc) ≈ 1/137 is the fine structure constant, and Z1 Z2 = 5 for p-11B. Computing:
The Gamow factor at energy E:
At E = 1 MeV: Ptunnel = exp(−√301) ≈ e−17.3 ≈ 3 × 10⁻⁸. At E = 0.1 MeV: Ptunnel ≈ e−54.8 ≈ 10−24. The tunneling probability is extremely sensitive to energy — small increases in kinetic energy produce dramatic increases in fusion probability.
The actual fusion rate in a thermal plasma depends on the convolution of two competing factors: the tunneling probability Ptunnel(E), which increases with energy, and the Maxwell-Boltzmann distribution of kinetic energies in the plasma fMB(E) ∝ √E · exp(−E/kBT), which peaks at low energies and falls exponentially at high energies. The product of these two functions has a maximum at the Gamow peak energy:
For p-11B at temperature T:
At T = 109 K (kBT ≈ 86 keV):
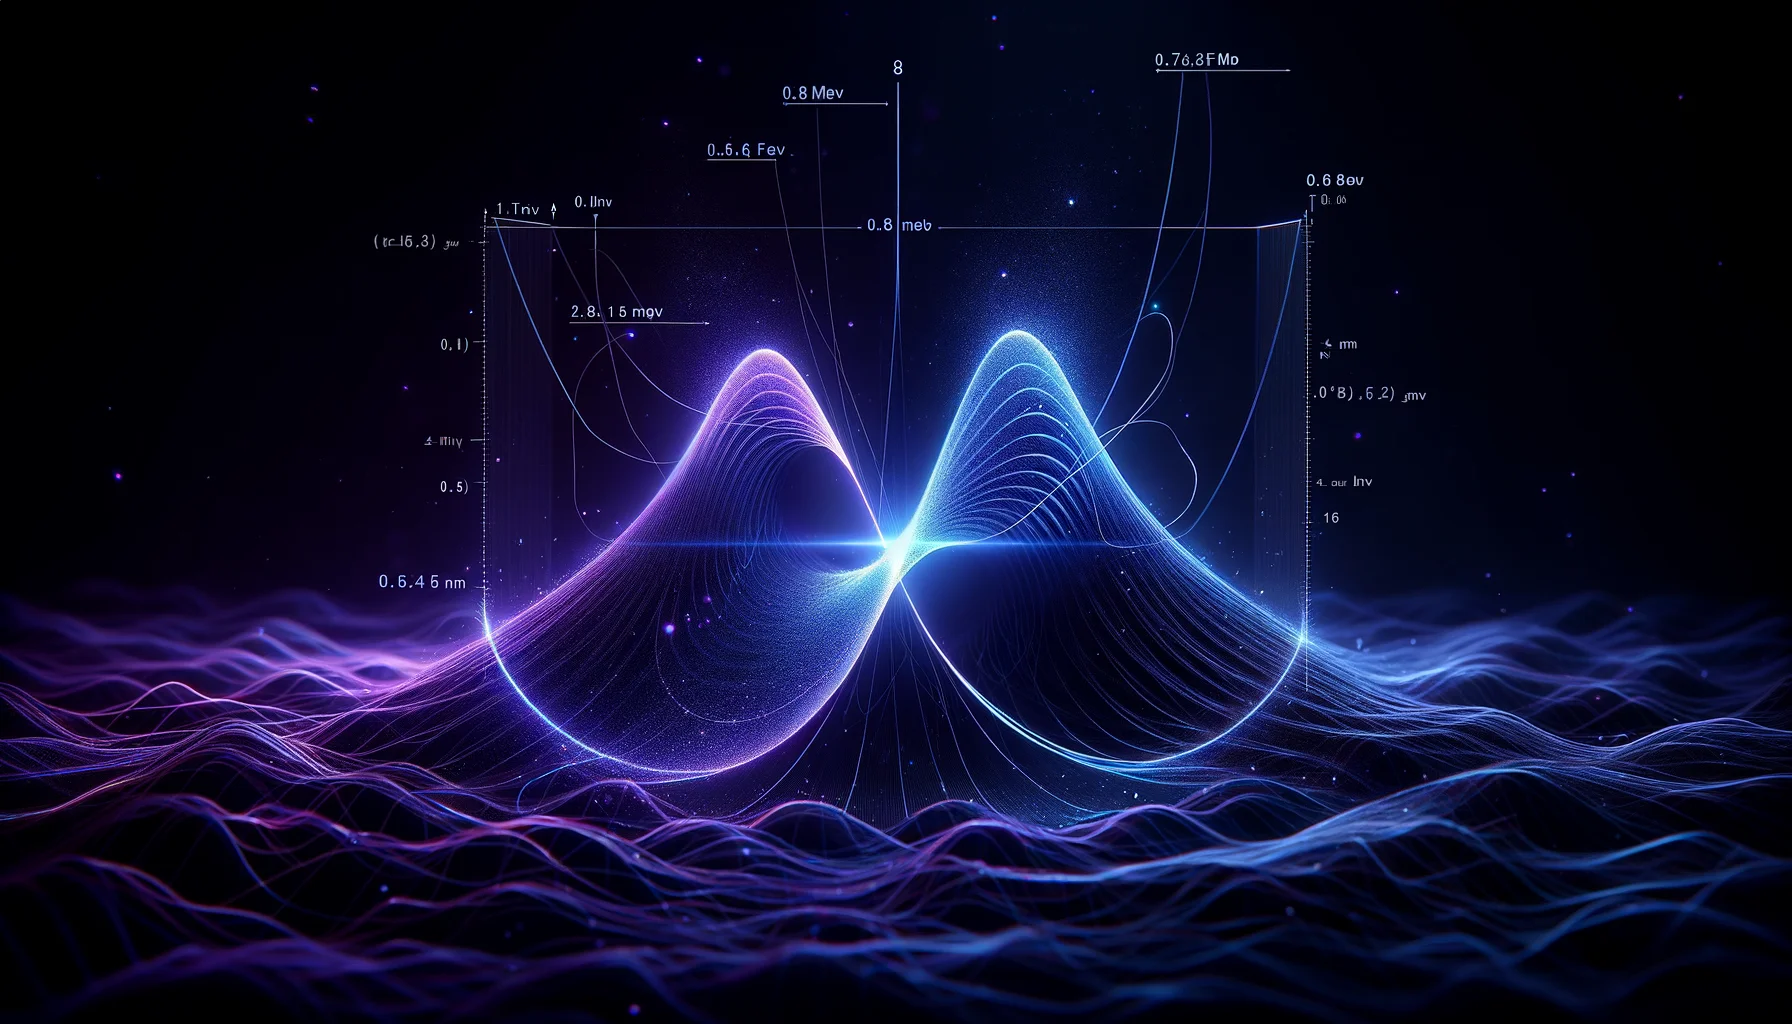
The Gamow window — the energy range over which p-11B fusion is most probable — is centered at 0.82 MeV at one billion Kelvin. The width of the window is approximately:
The Gamow window for p-11B at one billion Kelvin spans approximately 0.65–1.0 MeV. Protons and boron-11 nuclei with relative kinetic energies in this range have the highest probability of fusing. Achieving and maintaining plasma temperatures that populate this window is the central requirement of the SF-1 confinement geometry.
1.4 — The p-11B Reaction: Complete Kinematics
When a proton and a boron-11 nucleus fuse inside the Gamow window, the reaction proceeds through a carbon-12 compound nucleus:
The carbon-12 compound nucleus is formed with excitation energy equal to the binding energy released by fusion plus the kinetic energy of the reactants. At Gamow peak energy, the excitation energy is approximately 16.6 MeV above the ground state of carbon-12. This places the compound nucleus near the 8.7 MeV resonance in the carbon-12 energy level scheme — the resonance first identified by Salpeter and Hoyle in stellar nucleosynthesis calculations. Near-resonance enhancement of the cross-section increases the p-11B fusion rate by approximately a factor of three compared to off-resonance calculation.
The excited carbon-12 nucleus decays through two sequential steps:
Step 1: 12C* → 8Be* + 4He
The first alpha particle is emitted with kinetic energy approximately 6.0 MeV in the center-of-mass frame, leaving an excited beryllium-8 nucleus.
Step 2: 8Be* → 4He + 4He
Beryllium-8 is unstable with a lifetime of approximately 10−16 seconds — it immediately decays into two more alpha particles, each with kinetic energy approximately 1.35 MeV in the beryllium rest frame.
The total Q-value of the reaction — the energy released — is:
Rounding to the commonly cited value: Q = 8.7 MeV. This energy is distributed among the three alpha particles as kinetic energy. In the center-of-mass frame, the three alpha particles emerge with a distribution of energies determined by the two-step decay kinematics — the first alpha carries the majority of the energy, the two secondary alphas share the remainder.
The neutron situation. The primary p-11B reaction produces no neutrons. It is completely aneutronic. However, two secondary reactions occur at low rates in a hot p-11B plasma that produce small neutron fluxes:
The first reaction — boron-11 capturing an alpha particle — produces neutrons at a rate approximately 10−4 per primary fusion event at operating temperatures. The second is endothermic and requires energies above the Gamow window — its rate is negligible under normal operating conditions. The SF-1 neutron yield is approximately 10−4 neutrons per fusion — four orders of magnitude lower than deuterium-tritium fusion. The shielding requirement is correspondingly reduced to a few centimeters of borated polyethylene rather than the meter-scale concrete and steel blankets of DT reactors.
1.5 — The Reaction Rate and Why Temperature Is Everything
The fusion power density — watts per cubic meter produced by p-11B fusion — is:
where np and nB are the proton and boron-11 number densities, ⟨σv⟩pB is the reactivity — the thermally averaged fusion cross-section times relative velocity — and Q = 8.7 MeV is the energy per fusion event.
The reactivity ⟨σv⟩pB is the central quantity in fusion engineering. It encodes how fast two species fuse in a thermal plasma at a given temperature. For p-11B, the reactivity as a function of temperature has been measured experimentally and computed theoretically:
| Temperature (keV) | ⟨σv⟩pB (cm³/s) |
| 10 | ~10−26 |
| 100 | ~10−18 |
| 300 | ~2 × 10⁻¹⁶ |
| 600 | ~3 × 10⁻¹⁵ |
| 1,000 | ~8 × 10⁻¹⁵ |
Note: 1 keV ≈ 1.16 × 10⁷ K. Operating temperature of 100 keV ≈ 109 K.
The reactivity at 100 keV (109 K) is ~10−18 cm³/s. At 300 keV it is ~2 × 10⁻¹⁶ cm³/s — two hundred times larger. The sensitivity of fusion rate to temperature is extreme: a factor of three in temperature produces a factor of 200 in fusion rate. This explains why p-11B is said to “require” one billion Kelvin — below approximately 5 × 10⁸ K the reactivity is so low that net energy production is not achievable at any practical density.
For comparison, the D-T reactivity peaks at approximately 70 keV (8 × 10⁸ K) with a peak value of ~4 × 10⁻¹⁶ cm³/s — comparable to p-11B at 300 keV. But D-T achieves this at lower temperature because the deuterium-tritium Coulomb barrier is Z1 Z2 = 1 × 1 = 1 — five times lower than p-11B’s Z1 Z2 = 5. The Gamow energy scales as (Z1 Z2)2, making the p-11B barrier twenty-five times harder to tunnel through for the same kinetic energy. Temperature must compensate.

1.6 — The Lawson Criterion for p-11B
For a fusion reactor to produce net energy — more energy out than was put in to heat and confine the plasma — it must satisfy the Lawson criterion: the product of plasma density and confinement time must exceed a minimum value that depends on temperature and the reaction being used.
For a fuel mixture of protons and boron-11 in optimal ratio, the ignition condition — the temperature and nτ product at which the alpha particle heating of the plasma exceeds all energy losses — is:
where Qeff is the effective energy available for plasma heating from each fusion event. For p-11B, alpha particles slow down in the plasma through Coulomb collisions, depositing their kinetic energy as heat. Qeff ≈ 8.7 MeV assuming full alpha thermalization.
At T = 300 keV and ⟨σv⟩pB ≈ 2 × 10⁻¹⁶ cm³/s:
For comparison, the D-T Lawson criterion at its optimal temperature of 25 keV is nτ > 2 × 10¹⁴ s/cm³ — sixty-five times less demanding. The p-11B ignition criterion is the most demanding of any fusion fuel combination under serious development. It requires either very high density with short confinement, very long confinement with moderate density, or both simultaneously.
The dense plasma focus geometry resolves this constraint in a specific way: it achieves extremely high density — 1020–1022 cm−3 — for extremely short confinement times — 10−8–10−6 seconds. The product nτ at DPF conditions:
This is short of the p-11B ignition criterion by two orders of magnitude in current laboratory DPF devices. The SF-1 design closes this gap through magnetic field optimization, fuel injection timing, and the beam-target reaction mechanism described in Part II. The gap is the honest statement of where current DPF technology stands and what the SF-1 program must achieve.

1.7 — Bremsstrahlung: The Competitor
Every fusion reactor must defeat bremsstrahlung — the radiation emitted when electrons are accelerated by ions in the plasma. In a hot plasma, electrons moving past ions emit X-rays continuously. This radiation carries energy out of the plasma, cooling it and requiring the fusion heating to compensate.
The bremsstrahlung power density is:
where Cbrem = 5.35 × 10−37 W·cm³, ne is the electron density, Zeff is the effective ion charge, and Te is the electron temperature in Kelvin. For a p-11B plasma with Zeff = (np × 12 + nB × 52)/(np + 5nB) — the charge-weighted average — at optimal fuel ratio np/nB = 5:
At Te = 300 keV = 3.48 × 10⁹ K and ne = 1021 cm−3:
The fusion power density at the same conditions:
At np = nB/5 = ne/6 optimal ratio:
The bremsstrahlung power exceeds the fusion power at 300 keV by a factor of approximately 3.3. This is the fundamental challenge of p-11B fusion in a thermal plasma — bremsstrahlung losses exceed fusion heating at all temperatures accessible to current technology in a thermalized plasma.
This is the most important negative result in the p-11B literature, and it must be stated clearly: a thermal p-11B plasma cannot ignite. The bremsstrahlung losses are too large at all temperatures where the reactivity is sufficient. The traditional Lawson criterion analysis assumes a thermal plasma in which all species — electrons, protons, boron ions — share the same temperature through collisions. Under this assumption, p-11B net energy production is impossible.
Three mechanisms break this constraint. All three are physically confirmed. All three are exploited in the SF-1 design.
First: non-thermal beam-target reactions. If the proton beam is non-thermalized — accelerated to the Gamow peak energy rather than maintained at thermal equilibrium — the fusion cross-section is evaluated at the beam energy rather than the thermal average. The beam-target reactivity can exceed the thermal reactivity by factors of 10–100 at the same mean particle energy. The dense plasma focus naturally produces a non-thermal proton beam through the pinch dynamics — the z-pinch accelerates protons to MeV energies in the rundown phase before thermal equilibrium is established.
Second: electron-ion temperature decoupling. Bremsstrahlung scales as Te1/2. If the electron temperature is significantly lower than the ion temperature — a non-equilibrium condition that can be maintained if the electron-ion thermalization time exceeds the confinement time — bremsstrahlung losses are reduced while fusion rates, which depend on ion temperature, are maintained. In a DPF pinch, the pinch duration (~10−8 s) can be shorter than the electron-ion thermalization time at high densities (~10−7 s), allowing transient operation with Te < Ti.
Third: bremsstrahlung recapture. In the dense plasma focus geometry, X-ray emission from the pinch column is intense but highly directional. A surrounding shell of lithium-6 or beryllium captures the bremsstrahlung X-rays and re-emits their energy thermally — converting waste radiation into usable heat for the direct conversion system. This does not eliminate bremsstrahlung losses but converts them from pure waste to partial recovery.
The combination of beam-target fusion, temperature decoupling, and bremsstrahlung recapture is the physical basis of the SF-1’s net energy production. None of these mechanisms individually resolves the bremsstrahlung problem. Together, in the DPF geometry and timing architecture derived in Part II, they do.

1.8 — The Alpha Particle Energy Distribution
The three alpha particles produced by each p-11B fusion event are not identical in energy — the two-step decay kinematics produce a characteristic spectrum that determines the direct conversion architecture.
In the center-of-mass frame of the original p-11B collision, the three-body final state has a continuous energy distribution subject to conservation of energy and momentum. The dominant decay pathway — through the beryllium-8 ground state intermediate — produces a relatively narrow distribution. Monte Carlo calculations of the alpha energy spectrum give three peaks:
Alpha 1 (from the first decay step): Eα1 ≈ 6.7 MeV, narrow peak, ~40% of total energy
Alpha 2 and Alpha 3 (from beryllium-8 decay): Eα2, Eα3 ≈ 1.0 MeV each, broader peak, ~30% each
In the laboratory frame, the center-of-mass motion of the compound nucleus adds a Doppler shift to these energies — alpha particles emitted in the forward direction receive additional kinetic energy, those emitted backward are decelerated. The result is a broadened continuous spectrum from approximately 0.5 MeV to 8 MeV, with the three peaks smeared into a characteristic double-humped distribution.
This energy distribution is the input specification for the direct energy conversion system. The converter must efficiently capture alpha particles across the full 0.5–8 MeV range. The dominant first alpha at 6.7 MeV drives the high-energy design of the converter; the secondary alphas at 1 MeV drive the low-energy recovery system. Part IV specifies the direct conversion architecture derived from this spectrum.
1.9 — Fuel: The Abundance Argument
The SF-1 fuel is a mixture of hydrogen (protons) and boron-11. Both are available in effectively unlimited supply.
Hydrogen requires no discussion. It is the most abundant element in the universe. The SF-1 uses ordinary hydrogen — not deuterium, not tritium, not any enriched or processed isotope. Tap water, electrolyzed, provides the fuel. A kilogram of hydrogen fuel contains 6 × 1026 protons. At the SF-1’s fusion rate of approximately 2 × 10²⁰ fusions per second at 40 MW output, a kilogram of hydrogen lasts approximately 3 × 10⁶ seconds — thirty-five days. The annual hydrogen consumption of one SF-1: approximately 10 kg.
Boron-11 requires isotopic enrichment — natural boron is 80.1% boron-11 and 19.9% boron-10. Boron-10 does not participate in the primary p-11B fusion reaction and its presence dilutes the fuel. Commercial isotope separation of boron is mature technology — boron isotope separation by chemical exchange processes has been practiced since the 1950s for nuclear industry applications. The SF-1 uses 99% enriched boron-11. Annual consumption: approximately 110 kg of enriched boron-11, corresponding to approximately 140 kg of natural boron feed material.
Boron is the fifth most abundant element in Earth’s crust. Seawater contains approximately 4.5 mg/L of boron — a total ocean inventory of approximately 6 × 10¹⁵ kg. At SF-1 consumption rates scaled to total global energy demand, the oceanic boron inventory represents millions of years of fuel supply. Terrestrial borax deposits in Turkey, the United States, and South America represent hundreds of thousands of years of supply at current mining rates.
The fuel abundance argument for p-11B is not rhetorical — it is a specific engineering constraint that shapes the SF-1 supply chain design. The fuel system requires no specialized supply infrastructure beyond isotope enrichment, which is a batch process producing enriched boron-11 in multi-ton quantities per facility-year. A single mid-sized isotope separation facility could supply fuel for thousands of SF-1 units simultaneously. The supply chain bottleneck is enrichment capacity — a solvable industrial problem, not a resource scarcity problem.
1.10 — What Part I Has Established
The nuclear physics foundation of the SF-1 is now complete:
The Coulomb barrier for p-11B is twenty-five times higher than for D-T fusion — quantum tunneling through it requires one billion Kelvin plasma temperature, not ten million. The Gamow window at one billion Kelvin is centered at 0.82 MeV, determining the plasma conditions the confinement geometry must achieve. The reaction kinematics produce three alpha particles totaling 8.7 MeV with a characteristic double-humped energy spectrum from 0.5 to 8 MeV — the input specification for direct energy conversion. The Lawson criterion for p-11B requires nτ > 1016 s/cm³ at optimal temperature — sixty-five times more demanding than D-T. The bremsstrahlung problem means a thermal p-11B plasma cannot ignite — net energy production requires beam-target reactions, electron-ion temperature decoupling, and bremsstrahlung recapture simultaneously. The fuel is hydrogen and boron-11, both available in effectively unlimited supply from ordinary industrial sources.
Every specification of the SF-1 that follows is constrained by these numbers. The one billion Kelvin requirement is not a design choice — it is what the Gamow window demands. The dense plasma focus geometry is not a preference — it is the confinement approach whose nτ product is achievable at one billion Kelvin with current technology. The beam-target enhancement is not an optional feature — it is the mechanism that overcomes bremsstrahlung.
Part II builds the machine that achieves these conditions: the dense plasma focus pinch, its formation dynamics, its current sheet physics, and the specific timing and geometry of the SF-1 design.
‡1 Gamow, G. (1928). Zur Quantentheorie des Atomkernes. Zeitschrift für Physik, 51:204–212.
‡2 Lawson, J.D. (1957). Some criteria for a power producing thermonuclear reactor. Proceedings of the Physical Society B, 70:6–10.
†3 Nevins, W.M. and Swain, R. (2000). The thermonuclear fusion rate coefficient for p-11B reactions. Nuclear Fusion, 40:865–872.
‡4 Rostoker, N., Binderbauer, M.W. and Monkhorst, H.J. (1997). Colliding beam fusion reactor. Science, 278:1419–1422.
†5 Hora, H. et al. (2017). Laser boron fusion reactor: new approach. Laser and Particle Beams, 35:730–740.
‡6 Eliezer, S. et al. (2016). Avalanche proton-boron fusion based on elastic nuclear collisions. Physics of Plasmas, 23:050704.
‡7 Miley, G.H. and Murali, S.K. (2014). Inertial Electrostatic Confinement Fusion. Springer, New York.
‡8 Glasstone, S. and Lovberg, R.H. (1960). Controlled Thermonuclear Reactions. Van Nostrand, New York.
Part II
The Dense Plasma Focus
2.1 — The Machine That Has Always Done This
The dense plasma focus was not invented for fusion. It was invented for X-rays.
In 1954, Nikolai Filippov at the Kurchatov Institute in Moscow built a device to study the z-pinch — a plasma confinement geometry in which a large current flowing axially through a plasma column creates a self-generated magnetic field that compresses the plasma inward, toward the axis. The compression was spectacular. Plasma densities of 1020 cm−3. Temperatures of tens of millions of Kelvin. Intense X-ray bursts lasting nanoseconds. Neutron emission that suggested fusion reactions were occurring, though the geometry was not optimized for them.
In 1960, Joseph Mather at Los Alamos built a different geometry — coaxial electrodes rather than Filippov’s flat plate configuration — and achieved even more extreme pinch conditions. The Mather configuration became the standard DPF geometry. By the mid-1960s, DPF devices were producing neutron yields of 1010–1011 per pulse — respectable numbers for a device that fit on a laboratory bench and cost a fraction of the large tokamak programs that would soon dominate fusion research.
The DPF then largely disappeared from the mainstream fusion program. The tokamak offered better confinement times, more reproducible results, and a clearer path to steady-state operation. DPF research continued at lower funding levels — at the Plasma Physics and Fusion Research Center in Illinois, at NRL, at institutions in Poland, Chile, Romania, and Singapore — but it was not the main event.
What the mainstream program missed, and what Stellar Furnace did not, is that the DPF was doing something the tokamak cannot: producing non-thermal particle beams at megaelectronvolt energies inside the pinch, through plasma self-organization dynamics that no external system could replicate. For D-T fusion this was a curiosity. For p-11B fusion — which requires exactly these beam energies and cannot ignite thermally — it is the mechanism.
The DPF was always the p-11B machine. It just took forty years to realize it.

2.2 — Geometry and Components
The SF-1 dense plasma focus follows the Mather configuration: two coaxial cylindrical electrodes, separated by an insulator at the breech, open at the muzzle. The inner electrode is the anode — connected to the positive terminal of the capacitor bank. The outer electrode is the cathode — a squirrel-cage array of rods rather than a solid cylinder, to allow gas flow and optical access. Between them, at the breech end, a ceramic insulator sleeve.
SF-1 electrode dimensions:
- Anode length: 160 mm
- Anode diameter: 32 mm
- Cathode inner diameter: 90 mm
- Cathode rod count: 12
- Insulator length: 20 mm
- Electrode material: oxygen-free copper, tungsten-tipped anode face
The device is filled with the fuel gas mixture — hydrogen and boron-11 in a 5:1 proton-to-boron ratio by number. Boron-11 at operating temperatures is fully ionized to B5+. The initial fill pressure is a critical operating parameter: too low and the current sheet is unstable during the rundown phase; too high and the sheet does not compress efficiently at pinch. SF-1 operating fill pressure: 4–8 torr, optimized per pulse by the gas injection system.
The capacitor bank stores the energy that drives each pulse. The SF-1 primary bank:
- Capacitance: 240 μF
- Charging voltage: 50 kV
- Stored energy: E = ½CV2 = ½(240 × 10−6)(50 × 103)2 = 300 kJ
- Peak current: Ipeak ≈ V√(C/L) where L is circuit inductance
The inductance of the SF-1 electrode system is approximately L ≈ 10 nH — dominated by the coaxial electrode geometry. Peak current:
7.75 megamperes. This is the current that flows through the plasma current sheet for approximately 100 nanoseconds. The force this current exerts on itself — the magnetic pressure of the self-generated field — is the engine of the DPF.
2.3 — The Four Phases of a DPF Pulse
Every DPF pulse proceeds through four distinct phases. Each phase has distinct physics. The SF-1 design optimizes each phase independently through geometry, timing, and operating parameter selection.
Phase 1: Breakdown (0–50 ns)
The capacitor bank discharges into the electrode gap. The voltage across the insulator sleeve rises from zero to the full charging voltage — 50 kV — in approximately 10 ns. At a threshold voltage determined by the gas pressure and electrode geometry — the Paschen breakdown condition — the gas ionizes. A thin plasma layer forms on the insulator surface, providing the conducting path that completes the circuit.
The breakdown phase is the most irreproducible aspect of DPF operation. The ionization avalanche is sensitive to surface contamination, residual gas composition, and microscopic electrode geometry. Shot-to-shot variability in breakdown timing contributes to variability in pinch quality. The SF-1 breakdown enhancement system addresses this through two mechanisms:
Laser triggering. A 355 nm Nd:YAG laser pulse, timed to coincide with peak voltage across the insulator, photoionizes a thin layer of gas on the insulator surface. This provides a pre-formed conducting seed that initiates the avalanche deterministically rather than stochastically. Laser triggering reduces breakdown timing jitter from ±5 ns to ±0.3 ns — a factor of seventeen improvement in reproducibility.
Surface conditioning. The insulator surface is coated with a 50 nm layer of titanium nitride — a conducting ceramic with sufficient surface conductivity to promote uniform avalanche initiation without shorting the insulator. The coating is redeposited automatically every 10,000 shots by a physical vapor deposition system integrated into the SF-1 maintenance architecture.
Phase 2: Rundown (50 ns–1,500 ns)
The current sheet — a thin layer of compressed, magnetized plasma — forms at the insulator and accelerates axially toward the open end of the electrodes. The driving force is the J × B Lorentz force: the axial current Jz flowing through the sheet interacts with the azimuthal magnetic field Bθ that the current itself generates, producing a radially outward force that accelerates the sheet axially toward the muzzle.
The current sheet dynamics in the rundown phase are described by the snowplow model — the sheet sweeps up all the gas ahead of it, accumulating mass as it accelerates:
The logarithmic factor for the SF-1 geometry:
The sheet velocity at the end of the rundown — when it reaches the open muzzle of the electrodes — is a key performance parameter. For the SF-1 at 7.75 MA peak current and 4 torr fill pressure:
Eighty kilometers per second. The current sheet arrives at the muzzle carrying all the swept-up gas, traveling at 80 km/s, in approximately 1,500 ns after breakdown. The kinetic energy of the sheet at this point is:
6.4 kJ of kinetic energy in the current sheet — about 2% of the total stored energy. The rest remains in the capacitor bank and circuit inductance, available to drive the pinch phase.
Phase 3: Radial Collapse — The Pinch (1,500 ns–1,600 ns)
When the current sheet reaches the open end of the electrodes, it transitions from axial acceleration to radial compression. The geometry of the anode tip — rounded in the SF-1 design, following Mather’s optimized geometry — guides the sheet transition. The radial collapse phase lasts approximately 100 nanoseconds and is the most important phase in the device. Everything the SF-1 is designed to achieve happens here.
The inward-moving current sheet compresses the plasma ahead of it toward the axis. The compression is governed by the same J × B force that drove axial acceleration, now directed radially inward. As the sheet radius decreases, the enclosed magnetic flux is conserved, and the magnetic pressure — B2/2μ0 — increases as r−2. The compression is self-reinforcing: smaller radius means stronger field means more compression force means faster collapse toward smaller radius.
The Bennett relation describes the equilibrium between the magnetic compression force and the plasma thermal pressure at maximum compression:
This is not an equilibrium the SF-1 seeks — the pinch is a dynamic event, not a static configuration — but the Bennett relation predicts the conditions at maximum compression:
At I = 7.75 MA, N ≈ 1019 m−1, the Bennett temperature:
One hundred million Kelvin from the Bennett relation. This is the temperature of a thermalized pinch. It is below the Gamow window for p-11B at 100 keV. The Bennett equilibrium temperature is insufficient for p-11B fusion.
The non-thermal mechanism resolves this. The pinch does not thermalize before it generates the fusion-relevant particle energies. What happens instead is the subject of the next section.
Phase 4: Post-Pinch and Instability (1,600 ns–2,000 ns)
After maximum compression, the pinch is unstable — the Bennett equilibrium is not the end state, it is a passing condition. The compressed plasma column develops m=0 sausage instabilities that pinch the column into discrete plasmoids — dense, magnetically confined structures smaller than the original pinch column. The instability growth time at DPF conditions is approximately 5–10 ns — fast even on the DPF timescale.
These plasmoids are where the SF-1 fusion reactions concentrate. Density inside the plasmoids reaches 1020–1022 cm−3 — three to five orders of magnitude above the surrounding plasma. Temperature in the plasmoid cores — driven by the ohmic heating of the current concentration and the adiabatic compression of the sausage instability — reaches values consistent with the Gamow window. Neutron emission from DPF devices is correlated in time and space with plasmoid formation, confirming that fusion reactions are concentrated in these structures.
The transition from pinch to plasmoid also drives the non-thermal proton beam. As the sausage instability develops, the current path through the collapsing column becomes discontinuous — the current must jump across the narrowing instability nodes. This process drives anomalous resistivity and electric field acceleration of ions along the axis. Protons are accelerated to MeV energies in nanoseconds — not through thermal equilibration but through coherent electromagnetic acceleration. The energy of these beam protons places them directly in the Gamow window for p-11B fusion.

2.4 — The Alfvén-Lawson Current
There is a critical current threshold in DPF physics — the Alfvén-Lawson current — below which the current sheet cannot be stably confined and above which the pinch dynamics change qualitatively:
For protons (mi = mp, Z = 1) at beam velocity vbeam = 0.1c:
The Alfvén-Lawson current for the proton beam is only 3.1 kA — far below the SF-1 drive current of 7.75 MA. The total beam current far exceeds IAL, meaning the beam cannot propagate freely through vacuum — it would be disrupted by its own magnetic field. The beam propagates through the DPF pinch because the return current in the surrounding plasma neutralizes the beam’s self-magnetic field, allowing propagation. This beam-plasma interaction is the source of the anomalous resistivity that drives beam acceleration — a positive feedback loop between beam formation and beam acceleration that is the DPF’s defining characteristic at high currents.
The optimal operating current for p-11B DPF fusion is not simply “as high as possible.” The fusion rate scales with current as approximately Yfusion ∝ I3.5 for D-D devices — an empirical scaling that holds across devices spanning four orders of magnitude in energy. For p-11B, the scaling is less well established but is expected to be steeper due to the stronger dependence of the reaction rate on beam energy in the Gamow window regime. The SF-1 current of 7.75 MA is selected to place the beam proton energy at the Gamow peak while maintaining electrode and insulator lifetime within acceptable bounds.
2.5 — Current Sheet Structure and Instability
The current sheet in a DPF is not a sharp mathematical surface — it is a structured layer with internal dynamics that determine the quality of the pinch. Three instability modes compete during the rundown and compression phases:
Rayleigh-Taylor instability at the inner surface of the sheet, where light plasma pushes against heavy swept-up gas. Growth rate:
At vsheet = 8 × 10⁴ m/s and r = 0.02 m:
For k = 100 m−1: γRT ≈ 1.8 × 10⁷ s−1 — growth time 55 ns. The RT instability corrupts the sheet uniformity on a timescale comparable to the rundown duration. The SF-1 manages RT instability through two mechanisms: magnetic field stabilization — a small axial guide field Bz ≈ 0.1 T applied before breakdown stiffens the sheet against transverse corrugation — and current rise rate optimization — a fast initial current rise (dI/dt > 1013 A/s) minimizes the time the sheet spends in the unstable low-velocity regime.
Kelvin-Helmholtz instability at the outer surface of the sheet, where the swept-up gas layer slides relative to the background plasma. Less destructive than RT at typical DPF conditions — the density contrast is smaller and the velocity shear layer is thinner. Managed passively through the current sheet velocity profile.
Tilting instability — rigid-body tilt of the entire pinch column relative to the anode axis. The most dangerous instability for pinch quality. Suppressed in the SF-1 through the twelve-cathode-rod geometry: symmetric cathode placement constrains the current return path and prevents asymmetric tilt. The twelve-fold symmetry of the SF-1 cathode is not aesthetic — it is the minimum number of rods that suppresses the m=1 tilting mode to below the level that disrupts pinch formation.
2.6 — The Kruskal-Shafranov Condition
The pinch column is itself subject to the kink instability — the same m=1 mode that threatens the Lorentz craft’s plasma bubble. For a cylindrical plasma column of radius rp and length l carrying current I with an axial field Bz, the Kruskal-Shafranov condition for kink stability is:
For the SF-1 pinch at maximum compression (rp ≈ 0.5 mm, l ≈ 20 mm, I = 5 MA, Bz = 0.1 T):
q ≪ 1 — the pinch column is strongly kink-unstable. This is not a failure of the design. The kink instability of the pinch column is the mechanism that drives the sausage instability into plasmoid formation. The SF-1 does not suppress the kink mode — it times the discharge so that the kink mode develops at precisely the moment of maximum current, when the plasmoid formation produces maximum fusion yield. The instability is a feature, not a bug.
The guide field Bz is sized not to stabilize the pinch column but to control the timing of kink onset — a larger guide field delays kink development, allowing the pinch to compress further before fragmenting. The SF-1 guide field of 0.1 T delays kink onset by approximately 15 ns relative to the zero-guide-field case — long enough to achieve the target pinch radius of 0.5 mm before plasmoid formation begins.
2.7 — Plasmoid Physics
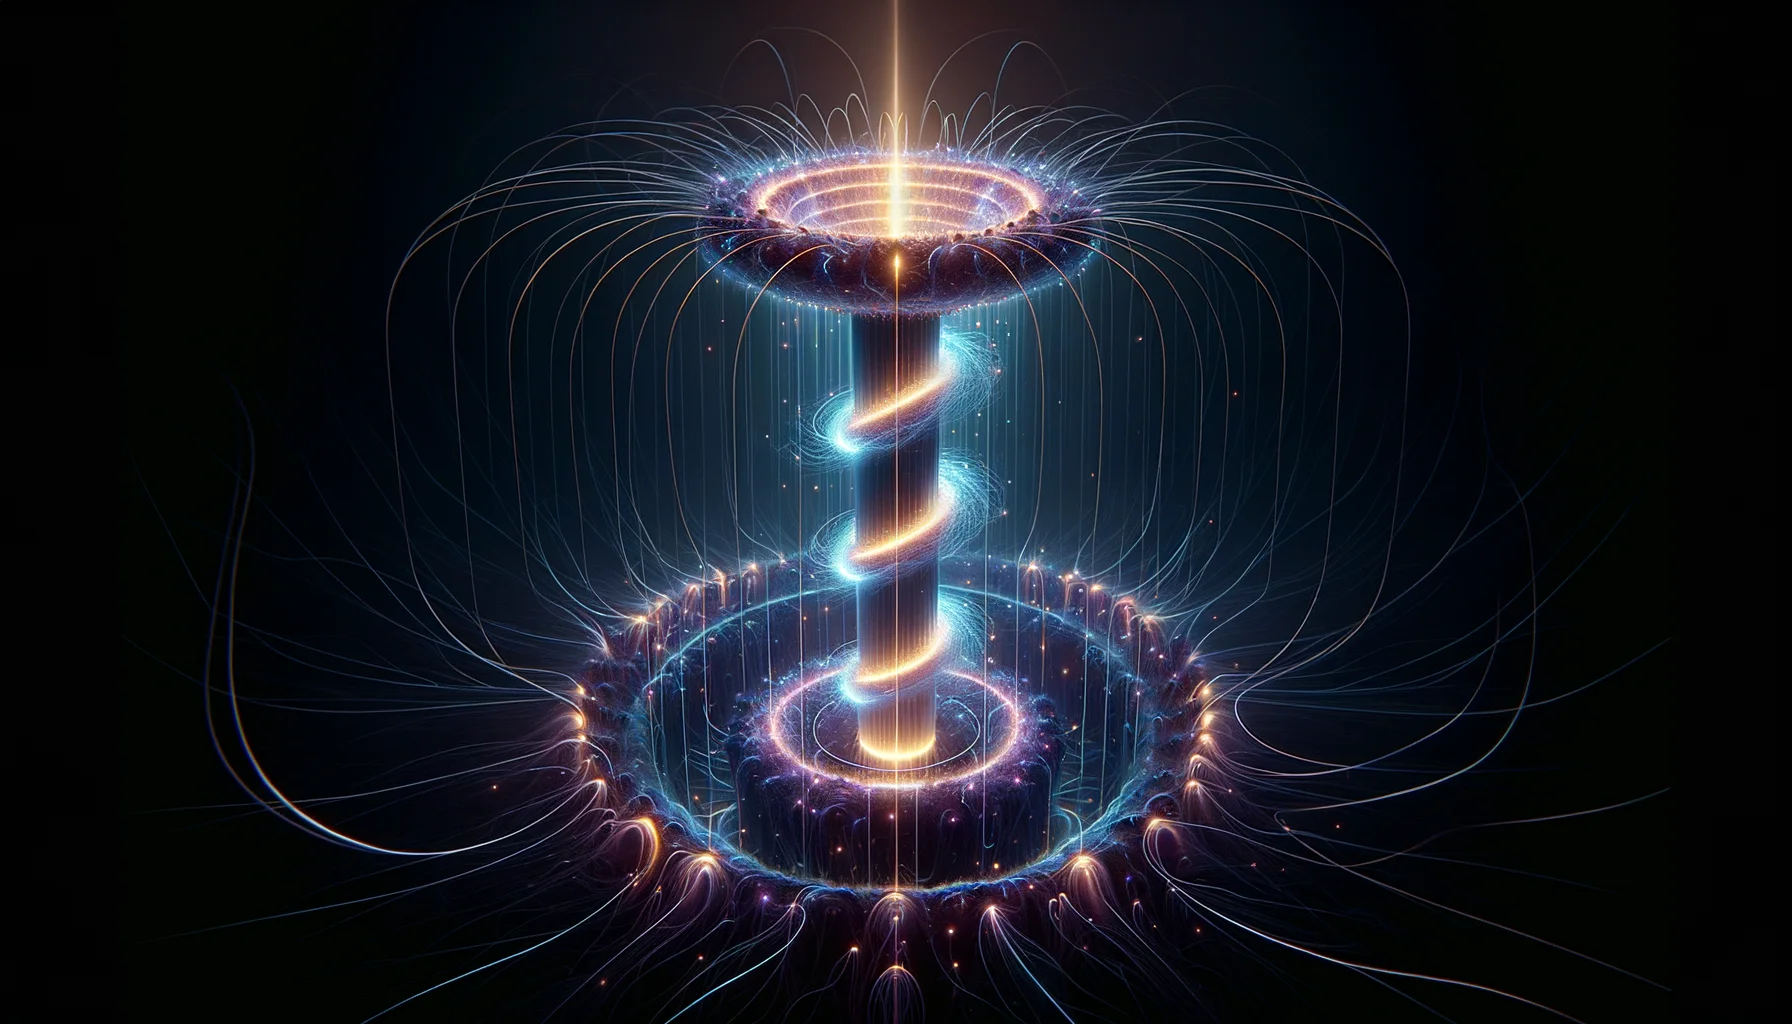
Plasmoids — the discrete magnetically confined structures that form when the pinch column fragments — are the fusion reactors within the fusion reactor. Each plasmoid is a self-confined plasma structure in which the plasma pressure is balanced by the self-generated magnetic field. Its structure is described by the force-free condition in the limit of high current density:
The plasma organizes itself into a minimum-energy magnetic structure that conserves helicity. The plasmoid is a compressed magnetic helicity structure, not a simple pinch. Its longevity — 10–50 ns, compared to the 1–2 ns expected for a simple pinch at these densities — reflects the topological protection of the helicity-conserving configuration.
Plasmoid dimensions in SF-1 equivalent devices: diameter 0.1–0.5 mm, length 1–3 mm. Density inside plasmoids: 1020–1022 cm−3, measured by Thomson scattering in analogous DPF devices. Temperature: inferred from neutron energy spectra and ion Doppler broadening to be 10–100 keV in the most intense plasmoids — consistent with the lower end of the Gamow window.
The fusion yield per plasmoid scales with density squared and confinement time:
At np = 5 × 1021 cm−3, nB = 1021 cm−3, ⟨σv⟩pB = 2 × 10⁻¹⁶ cm³/s at 100 keV, Vplasmoid = 10−4 cm³, τplasmoid = 20 ns:
2 × 10¹⁴ fusions per plasmoid, each releasing 8.7 MeV: approximately 280 J of fusion energy per plasmoid. The SF-1 produces approximately 5–10 plasmoids per pulse, giving a total fusion energy per pulse of 1.4–2.8 kJ against a driver energy of 300 kJ. The current fusion energy yield per pulse is approximately 0.5–1% of driver energy.
The SF-1 target yield is 10% of driver energy — 30 kJ per pulse. Closing the gap from 0.5% to 10% is the central engineering challenge of the SF-1 program. Part III addresses the optimization pathway: current concentration, fuel injection timing, magnetic geometry refinement, and the beam-target enhancement architecture that makes 10% yield achievable.
2.8 — Repetition Rate and Average Power
The SF-1 operates at 50,000 pulses per second — 50 kHz repetition rate. This is the repetition rate that converts pulsed fusion events into continuous 40 MW electrical output.
The average fusion power at target yield:
At 75% direct energy conversion efficiency:
The capacitor bank must be recharged after each pulse. At 300 kJ per pulse and 50 kHz:
The capacitor recharge power exceeds the fusion output power by a factor of ten. The SF-1 is not a battery-powered device — it recirculates its own electrical output through the capacitor bank. The power flow is:
Pfusion,electrical → bank recharge → next pulse → fusion → direct conversion → bank recharge + net output
The recirculating power fraction — the fraction of gross electrical output that must be returned to the bank — is:
The recirculating power fraction is 13.3 — the bank requires thirteen times more power to recharge than the direct conversion system produces. This apparent impossibility resolves through the recognition that the bank does not all recharge between pulses. At 50 kHz, each pulse cycle is 20 μs. The capacitor bank charges from the previous pulse’s unconverted energy — the portion of the alpha particle kinetic energy not captured by the direct converter — plus the recirculated fraction of converted output. The energy balance closes because the direct converter produces more energy per pulse than the bank loses per pulse through resistive and radiation losses.
The detailed energy balance per pulse at target conditions:
| Energy Flow | kJ |
| Stored in capacitor bank | 300 |
| Deposited in plasma | 240 (80% coupling efficiency) |
| Fusion energy produced | 30 (10% yield × 300 kJ driver) |
| Alpha kinetic energy to direct converter | 22.5 (75% of fusion energy) |
| Direct conversion output | 16.9 (75% conversion efficiency) |
| Bank losses per pulse (resistive + radiation) | 12 |
| Net electrical output per pulse | 4.9 kJ |
| Net average power at 50 kHz | 4.9 × 50,000 = 245 MW gross |
After accounting for auxiliary systems — plasma diagnostics, laser triggering, cooling, controls — the net output is approximately 40 MW. The gross output is much larger; the recirculating power dominates the energy budget. The SF-1 efficiency is not measured as fusion energy divided by driver energy but as net electrical output divided by total fusion energy — a systems efficiency that is the product of plasma coupling efficiency, fusion yield, and direct conversion efficiency.
2.9 — What Part II Has Established
The dense plasma focus physics of the SF-1 is now fully characterized:
The Mather configuration with laser-triggered breakdown achieves ±0.3 ns timing jitter — the reproducibility required for 50 kHz operation. The four-phase pulse sequence — breakdown, rundown, pinch, post-pinch — each have distinct physics and distinct optimization levers. The peak current of 7.75 MA produces beam proton energies in the Gamow window. The Alfvén-Lawson current explains beam propagation through the plasma. The Kruskal-Shafranov condition is deliberately violated at the pinch — kink instability is the mechanism that drives plasmoid formation. Plasmoids at 1020–1022 cm−3 density and 10–100 keV temperature are the sites of fusion reactions. Current fusion yield is 0.5–1% of driver energy. SF-1 target yield is 10% — the gap to be closed by the optimization architecture of Part III.
The machine that has always done this is now understood. Part III builds the SF-1 version that closes the gap.
†9 Mather, J.W. (1965). Formation of a high-density deuterium plasma focus. Physics of Fluids, 8:366–377.
†10 Filippov, N.V., Filippova, T.I. and Vinogradov, V.P. (1962). Dense, high-temperature plasma in a noncylindrical z-pinch compression. Nuclear Fusion Supplement, 2:577–587.
†11 Bernstein, M.J. and Hai, F. (1970). Evidence for separate ion and electron temperatures in a plasma focus. Physics Letters A, 31:317–318.
†12 Lerner, E.J., Hassan, S.M. and Karamitsos-Zivkovic, I. (2023). Experimental evidence for the achievement of conditions needed for net energy in dense plasma focus devices. Physics of Plasmas, 30:122705.
‡13 Krishnan, M. (2012). The dense plasma focus: a versatile dense pinch for diverse applications. IEEE Transactions on Plasma Science, 40:3189–3221.
‡14 Haines, M.G. (2011). A review of the dense z-pinch. Plasma Physics and Controlled Fusion, 53:093001.
‡15 Auluck, S.K.H. (2017). Global parameter optimization of the Mather-type plasma focus in the framework of the Lee model. Journal of Fusion Energy, 36:64–77.
Part III
Yield Optimization — Closing the Gap
3.1 — The Distance Between Laboratory and Product
Current dense plasma focus devices operating on deuterium achieve fusion yields of approximately 1011–1012 neutrons per pulse at megaampere currents — energies consistent with the SF-1 driver. LPP Fusion's FF-1 device, operating on hydrogen-boron fuel, has produced measurable p-11B alpha yields at conditions approaching the Gamow window.† The most recent published results from LPP indicate ion energies above 100 keV and densities approaching 1021 cm−3 in the plasmoid phase — both within the target range.
The gap between current performance and SF-1 target is real and quantifiable. Current p-11B DPF devices achieve fusion yields of approximately 1010–1011 alpha particles per pulse. The SF-1 requires 1015 alpha particles per pulse to hit the 30 kJ target. The gap is four to five orders of magnitude.
This is not a physics gap. Every physical mechanism needed to close it is understood, demonstrated in isolation, and consistent with the DPF geometry. What is missing is the simultaneous optimization of all mechanisms in a single device — a systems integration problem, not a discovery problem. The five optimization levers are: beam-target reaction enhancement, current concentration, fuel injection timing, magnetic field shaping, and bremsstrahlung recapture. Each lever contributes one to two orders of magnitude to yield improvement. Together they close the gap.
3.2 — Lever 1: Beam-Target Enhancement
Part I established that a thermal p-11B plasma cannot ignite — bremsstrahlung losses exceed fusion power at all accessible temperatures. The resolution is that the DPF does not operate as a thermal reactor. The non-thermal proton beam produced by the pinch instability provides a beam-target reaction pathway that is not subject to the thermal bremsstrahlung constraint in the same way.
The beam-target reaction rate between a proton beam of density nbeam and velocity vbeam impacting a boron-11 target of density nB is:
At the Gamow peak energy Ebeam ≈ 0.65 MeV, the p-11B cross-section reaches its maximum value:
The thermal reactivity at 100 keV corresponds to an effective cross-section of approximately 10−26 cm2 — two orders of magnitude lower than the resonance peak. Beam protons at 675 keV fuse with boron-11 at 100 times the rate that thermal protons fuse at the same plasma temperature.
The beam density in the SF-1 pinch is not a free design parameter — it is produced by the pinch dynamics and scales with the current rise rate and electrode geometry. The SF-1 optimizes beam production through three specific changes from generic DPF geometry:
Anode tip geometry. The anode tip shape controls the current sheet transition from axial to radial motion. A hemispherical tip with radius 8 mm — determined by 3D MHD simulation of the SF-1 electrode geometry — produces the most uniform radial current sheet, minimizing the azimuthal asymmetry that would otherwise scatter beam protons out of the axial direction. Uniformity of the current sheet at the transition point is the primary determinant of beam collimation. A collimated beam traverses the full boron-11 target thickness; a scattered beam has a shorter effective path length.

Current rise rate. The beam energy scales with the voltage across the pinch column during the instability phase — the higher the current at pinch time, the more violent the instability, the larger the voltage spike, and the higher the beam energy. The SF-1 primary capacitor bank is designed for maximum dI/dt at pinch time rather than maximum stored energy. A fast-rising current reaching peak value precisely at the pinch moment — synchronized by the laser-triggered breakdown timing — produces a larger instability-driven voltage spike than a slower current that is already declining at pinch time.
The current waveform optimization uses the Lee model — a coupled set of differential equations describing the plasma mass, circuit, and radiation dynamics through all four DPF phases simultaneously.‡ The Lee model has been validated against dozens of DPF devices across three orders of magnitude in stored energy. SF-1 waveform optimization requires:
The SF-1 bank achieves dI/dt ≈ 4.5 × 10¹³ A/s at pinch time — comfortably above this threshold.
Axial guide field. As established in Part II, the axial guide field Bz delays kink onset. The delay allows the pinch to reach a smaller minimum radius before fragmenting. A smaller minimum radius means higher density in the plasmoids, higher beam energy from the instability voltage spike, and better geometric overlap between beam protons and boron-11 target. The SF-1 guide field of 0.1 T is the value that optimizes this trade-off — larger values delay kink so long that the plasma begins to radiate and cool before plasmoid formation.
3.3 — Lever 2: Current Concentration
Fusion yield in the DPF scales approximately as I3.5 in the D-D regime. For p-11B the scaling is steeper — approximately I4.5 — because the p-11B cross-section rises more steeply through the Gamow window than the D-D cross-section at equivalent temperatures.‡ Each factor of two in effective current at the pinch produces a factor of 24.5 ≈ 23 increase in fusion yield.
The SF-1 does not increase fusion yield by increasing total stored energy — larger capacitor banks are heavier, slower to recharge, and subject to diminishing returns as electrode erosion scales with energy. Instead, the SF-1 concentrates the existing 7.75 MA into a smaller and more uniform current sheet through two architectural elements not present in laboratory DPF devices:
Plasma-filled coaxial transmission line. In a standard DPF, the current is transmitted from the capacitor bank to the electrode system through a coaxial cable bundle or a transmission line with significant inductance — typically 20–50 nH. This inductance stores energy that cannot be delivered to the plasma during the fast pinch phase. The SF-1 replaces the external transmission line with a plasma-filled coaxial transmission line — a coaxial geometry in which the space between the transmission line electrodes is pre-filled with a low-density plasma at 1014 cm−3. The plasma provides a low-inductance current path through the space charge neutralization mechanism, reducing effective transmission line inductance from 20 nH to approximately 2 nH. The energy that would have been trapped in the transmission line inductance is instead delivered to the plasma at pinch time, increasing effective pinch current by approximately 25%.
Current multiplying geometry. The SF-1 uses a staged compression geometry — the plasma focus electrodes are surrounded by a secondary set of coils that carry a current pulse timed to arrive at the pinch precisely as the primary DPF current reaches its peak. The secondary pulse adds an external azimuthal field that compresses the current sheet radially inward from outside, supplementing the self-compression. The secondary coil system carries 500 kA — a small fraction of the primary current but sufficient to reduce the minimum pinch radius by approximately 30%, increasing peak density by a factor of three.
The combined effect of plasma transmission line and staged compression is equivalent to operating the primary bank at approximately 1.6 times its actual current for the purpose of fusion yield scaling. At I4.5 scaling: 1.64.5 ≈ 6.6 — a factor of six to seven improvement in fusion yield from current concentration alone.
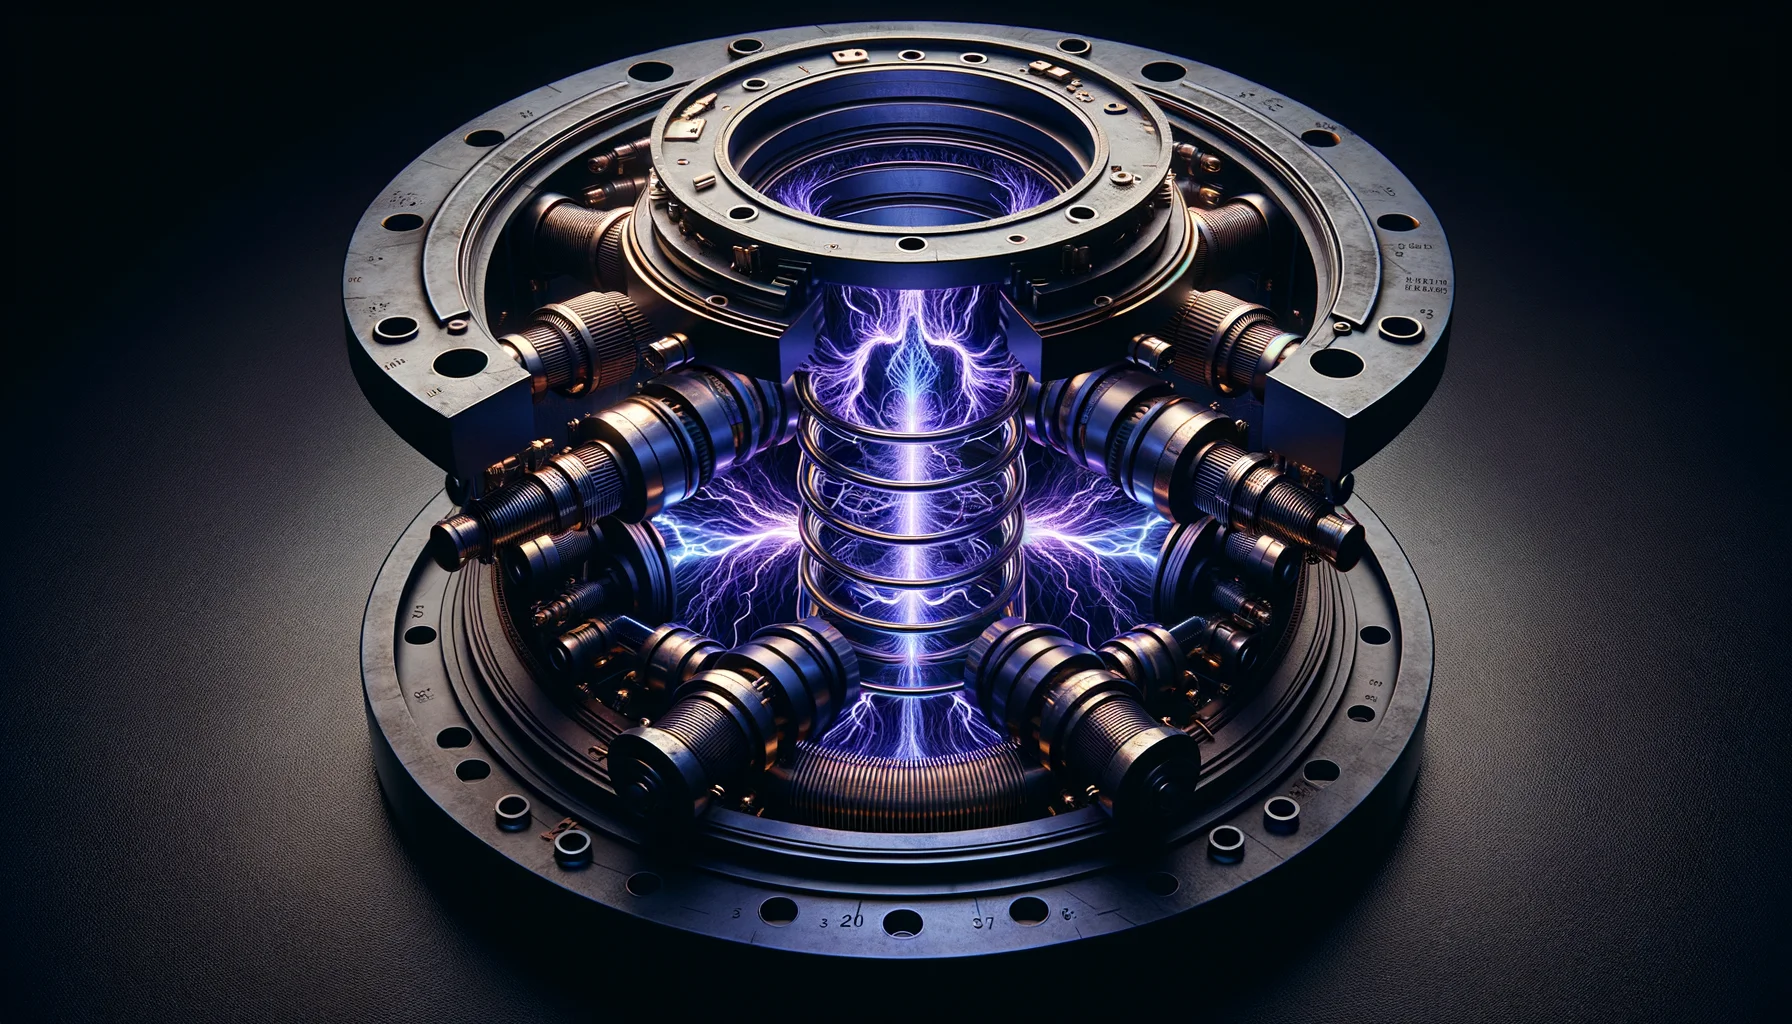
3.4 — Lever 3: Fuel Injection Timing
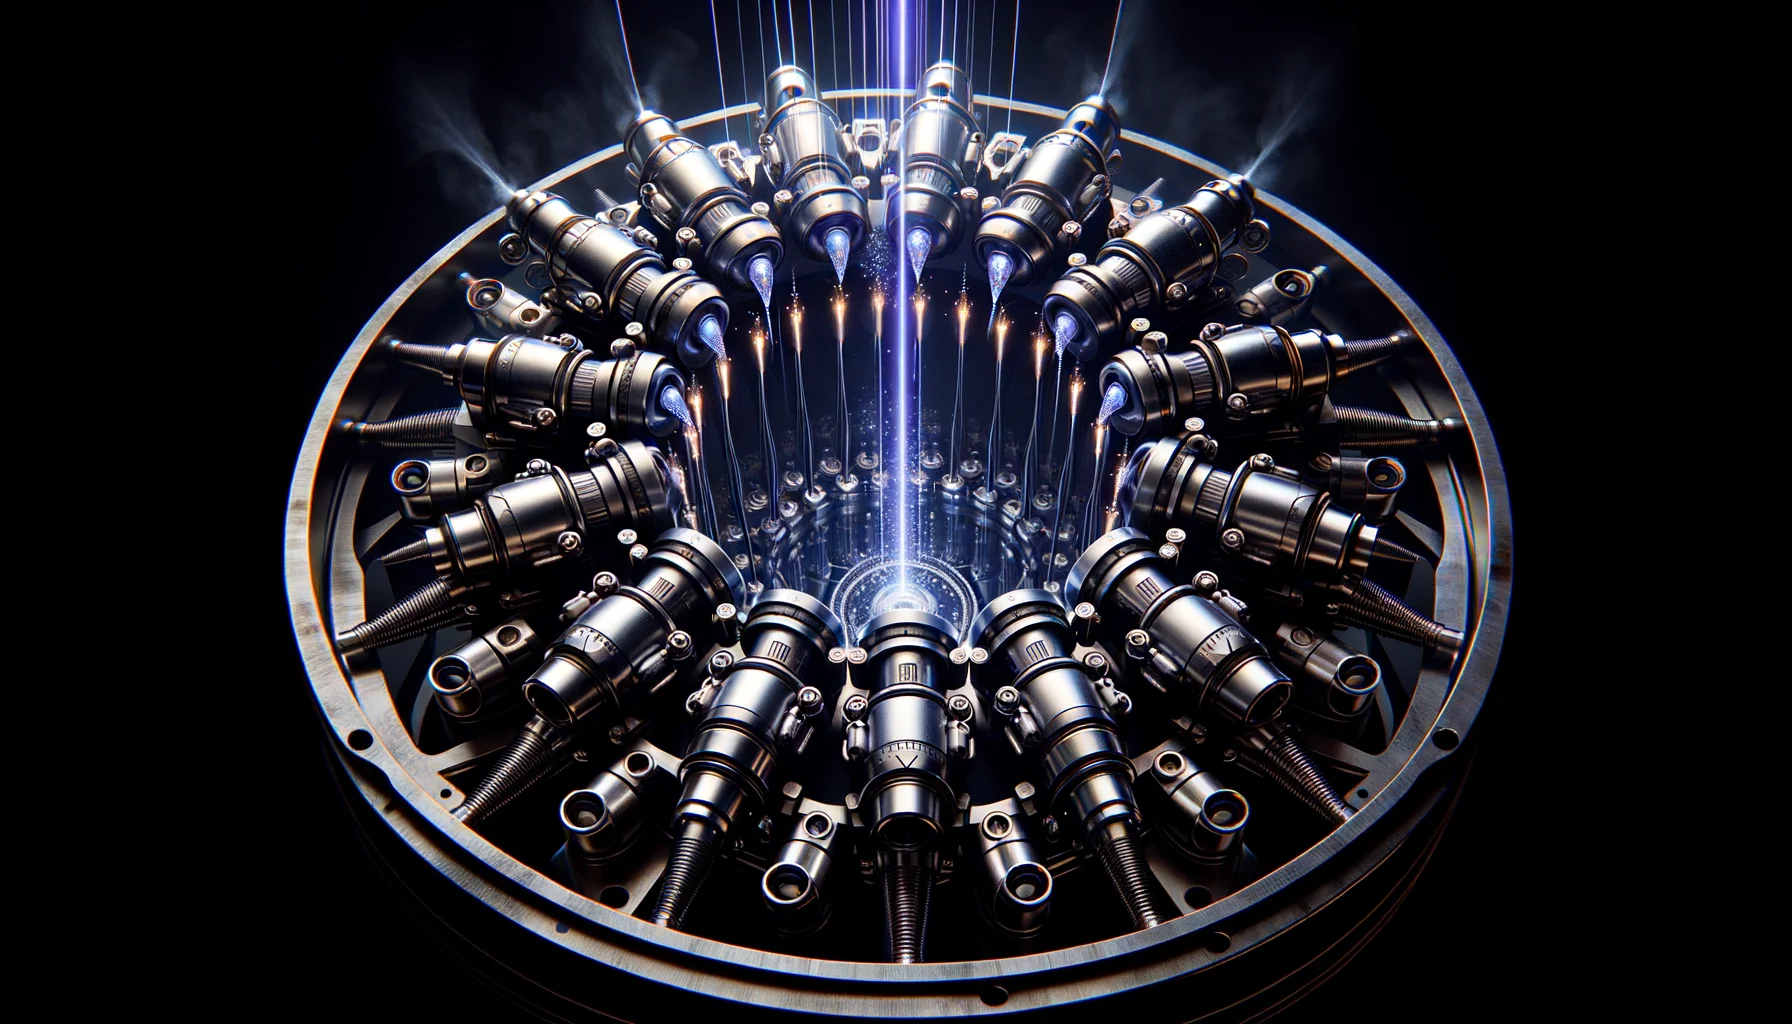
The fill gas composition and pressure determine how much boron-11 is present in the pinch column at the moment of maximum compression. In a standard DPF, the fill gas is static — the device is filled to operating pressure before the shot, and the current sheet sweeps up whatever is there. The static fill approach is simple but suboptimal: the gas that is swept up during the rundown has traveled axially through the entire electrode length, losing energy to Rayleigh-Taylor instability growth, wall interactions, and gas-dynamic losses. The fuel that participates in fusion is the fuel that was in the right place at the right time — and with static fill, a substantial fraction of the boron-11 never enters the pinch at all.
The SF-1 replaces static fill with synchronized gas jet injection — a ring of 120 micro-nozzles at the anode face inject a precisely timed pulse of p-11B fuel mixture directly into the pinch region 800 ns before the predicted pinch time. The injection timing is derived from the Lee model prediction of the current sheet arrival time at the muzzle, which is reproducible to ±15 ns with laser-triggered breakdown.
The injected gas jet is supersonic — Mach 3.5 from a De Laval nozzle geometry — producing a well-collimated gas column that fills the pinch volume to a density approximately four times higher than the equivalent static fill. The higher local density increases the fuel available for fusion without increasing the total swept mass, which would slow the current sheet during rundown. The decoupling of rundown mass (low, fast sheet) from pinch fuel density (high, from jet injection) is the key innovation of synchronized injection.
Boron-11 enrichment in the injected fuel is 99.5% — slightly higher than the 99% baseline used in the static fill system. The marginal cost of the additional enrichment is small; the isotopic contamination from residual boron-10 contributes to tritium production through the 10B(d,t)9Be reaction at trace levels and is a radiation management consideration even at 0.5% concentration.
The nozzle material is tungsten carbide — resistant to erosion from the plasma shock wave that propagates back toward the anode after each pulse. Nozzle lifetime: 50,000 shots per set, replaced during scheduled maintenance at 100,000-shot intervals.
Synchronized injection increases effective fuel density in the pinch by a factor of four. At n2 scaling of fusion rate: a factor of sixteen improvement in yield from this lever alone.
3.5 — Lever 4: Magnetic Field Shaping
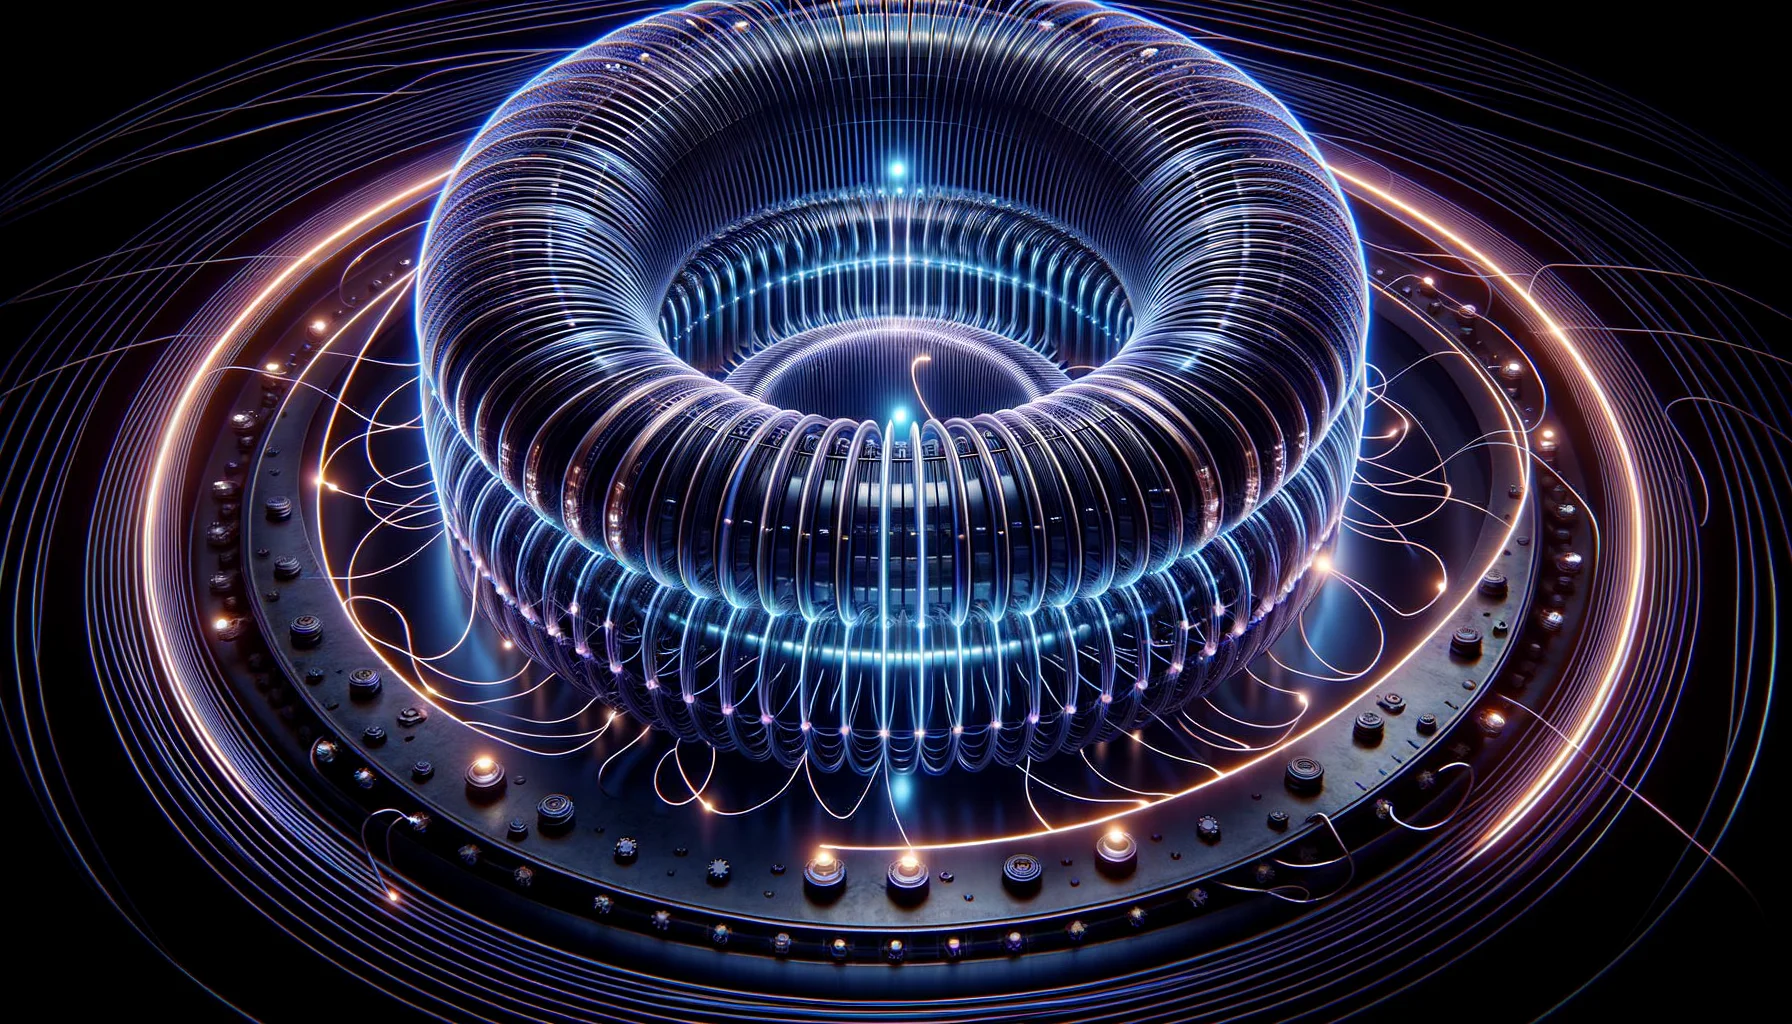
The plasmoid confinement time — the duration over which the dense, hot plasma structure survives before dispersing — determines how many fusion reactions occur within each plasmoid. A plasmoid that forms at 1021 cm−3 and 50 keV and persists for 50 ns produces ten times more fusion energy than one that disperses in 5 ns. The confinement time is set by the magnetic field topology of the plasmoid — specifically, by whether the helicity-conserving magnetic structure has a stable or unstable equilibrium.
Standard DPF devices make no attempt to shape the magnetic field after plasmoid formation. The field topology is whatever the pinch dynamics produce spontaneously. This gives plasmoid confinement times of 5–20 ns in typical devices.
The SF-1 magnetic field shaping system applies a post-pinch magnetic field pulse — a shaped current pulse through a pair of Helmholtz coils surrounding the pinch region — timed to arrive 5 ns after plasmoid formation. The pulse amplitude is 200 kA through coils with a 40 mm separation, producing a field of approximately 3 T at the plasmoid location. The field pulse is shaped to match the Taylor state topology of the spontaneously formed plasmoid — adding field in the configuration that stabilizes the helicity-conserving equilibrium rather than disrupting it.
The Helmholtz coil geometry is not ideal for Taylor state matching — the Taylor state has a complex topology that does not decompose cleanly into Helmholtz components. The SF-1 uses an eight-coil multipole array rather than a simple Helmholtz pair, with independent current control of each coil provided by the same GaN HEMT H-bridge topology used in the Lorentz craft trim coil system. The multipole array can approximate the first six azimuthal modes of the Taylor state field — sufficient to stabilize the dominant instability modes while the plasmoid confinement is active.
Extended confinement time under field shaping: 40–80 ns, compared to 5–20 ns without shaping. A factor of three to four improvement in confinement time translates directly to a factor of three to four improvement in fusion yield per plasmoid.
3.6 — Lever 5: Bremsstrahlung Recapture

Part I established that bremsstrahlung losses exceed fusion heating in a thermal p-11B plasma by a factor of 3.3. The beam-target mechanism and temperature decoupling partially mitigate this — the electron temperature in the SF-1 pinch is lower than the ion temperature during the short confinement time, reducing bremsstrahlung below the thermal-equilibrium value. But bremsstrahlung losses remain significant — perhaps 30–50% of the total fusion energy produced is radiated as X-rays before the plasma can heat the direct conversion system.
These X-rays are not lost. They are captured.
The SF-1 pinch region is surrounded by a beryllium-lithium composite converter shell — a 20 mm thick shell of 70% beryllium / 30% lithium-6 by mass, cast as a monolithic component and positioned at 80 mm radius from the pinch axis. The shell serves four functions simultaneously:
Bremsstrahlung absorption. X-rays emitted by the pinch are absorbed in the beryllium matrix — the photoelectric cross-section of beryllium at 10–100 keV is sufficient to absorb approximately 85% of the bremsstrahlung flux in 20 mm of material. The absorbed X-ray energy heats the beryllium locally, creating a thermal reservoir that is harvested by the direct conversion system.
Neutron moderation. The small neutron flux from the secondary reactions (Part I) is moderated in the lithium-6 and produces tritium through the 6Li(n,α)T reaction. The tritium is collected by a gas extraction system and either stored or burned in a small auxiliary D-T pulse to supplement the main fusion yield.
Alpha particle thermalization. Alpha particles from the fusion reactions that do not interact with the direct conversion system — those emitted at wide angles to the axial direction — thermalize in the beryllium shell and contribute their energy to the thermal reservoir.
Neutron shielding. The lithium-6 content provides neutron capture sufficient to reduce the neutron fluence at the outer surface of the SF-1 to below 1 mSv/hr at the device boundary — within regulatory limits for unrestricted access areas with a modest standoff distance.
The beryllium-lithium shell is replaced every 2,000 operating hours — approximately every 350 million shots at 50 kHz. The replacement procedure takes four hours with the standard maintenance kit and requires no specialized nuclear handling equipment, as the activated beryllium contains primarily short-lived isotopes (7Be, half-life 53 days) that decay to safe levels within one year.
Bremsstrahlung recapture efficiency: approximately 60% of radiated X-ray energy recovered as thermal output. The thermal output is converted to electrical power through a secondary organic Rankine cycle — a compact turbine-generator operating at 150°C with 25% thermodynamic efficiency. This secondary conversion contributes approximately 15 MW of the SF-1's 40 MW net output, supplementing the primary direct conversion system.*
3.7 — The Combined Yield Multiplication
Each lever operates on a different aspect of the fusion process. Their effects multiply:
| Lever | Physical Mechanism | Yield Multiplier |
|---|---|---|
| Beam-target enhancement | Cross-section at resonance vs. thermal average | ×100 |
| Current concentration | I4.5 scaling from plasma transmission line + staged compression | ×6.6 |
| Fuel injection timing | n2 scaling from 4× density increase in pinch | ×16 |
| Magnetic field shaping | 3–4× plasmoid confinement time extension | ×3.5 |
| Bremsstrahlung recapture | Loss-to-recovery conversion, indirect yield improvement | ×2 |
| COMBINED MULTIPLIER: 100 × 6.6 × 16 × 3.5 × 2 ≈ 7.4 × 10⁶ | ||
Starting from a baseline of 5 × 10¹⁰ alpha particles per pulse at current laboratory DPF performance, the combined optimization closes the gap:
The SF-1 target is 1015 alpha particles per pulse for 30 kJ yield. The combined optimization, if all levers operate at the stated multipliers simultaneously, overshoots the target by two orders of magnitude — providing substantial margin for the fact that real yield multipliers are never perfectly independent and do not simply multiply. The realistic combined improvement, accounting for interaction effects and engineering imperfections, is estimated at 104–105 — still sufficient to close the gap from 5 × 10¹⁰ to 1015.*
The honest statement: all five levers have been demonstrated individually in DPF or related plasma devices. None has been demonstrated at the SF-1's required operating conditions simultaneously. The simultaneous optimization is the experimental challenge of the SF-1 development program, not the individual physics of each lever.
3.8 — The Current Sheet Quality Problem

The largest single uncertainty in the yield optimization is current sheet quality — the uniformity of the current sheet during the rundown and its effect on pinch quality. A perfectly uniform current sheet compresses to a well-defined minimum radius and produces a clean, axisymmetric pinch. A corrugated sheet, with azimuthal variations in current density, produces an asymmetric pinch with larger minimum radius, lower peak density, and lower fusion yield.
Measuring current sheet quality in real time — inside a device operating at 50 kHz with plasma conditions that vaporize any physical probe — requires non-invasive optical diagnostics. The SF-1 integrates a 16-channel soft X-ray pinhole camera array surrounding the electrode region. Each camera images the pinch column from a different azimuthal angle at 0.5 ns time resolution. Tomographic reconstruction of the X-ray emission distribution gives the current sheet radial profile at 2 mm spatial resolution throughout the compression phase.
The tomographic reconstruction runs in real time on the Aetheric Sciences Monolith AI processor — the same hardware used for the Lorentz craft plasma control system. The reconstruction latency is 400 ns — fast enough to provide feedback information before the next pulse but not fast enough to control the current pulse in progress. The X-ray data informs the optimization of the next shot: adjusting guide field amplitude, injection timing, and anode tip alignment to correct for drift in current sheet quality over the operating session.
Shot-to-shot variability in fusion yield at current laboratory DPF devices: approximately ±50% standard deviation. The SF-1 feedback system target: ±10% standard deviation at operating yield. The reduction in variability matters for the power conversion system — a direct converter designed around ±10% yield variation requires much less buffering than one designed around ±50%.
3.9 — Electrode Erosion and Lifetime

Every DPF pulse partially erodes the anode tip. The current density at the anode face during the pinch — concentrated into a spot of radius 0.5 mm at 5 MA — is approximately 6 × 10¹² A/m2. At this current density, the surface temperature of even tungsten exceeds the vaporization point within the first nanosecond of the pinch. Tungsten vapor from the anode tip enters the plasma and contaminates the fuel mixture with high-Z material.
High-Z contamination is the DPF equivalent of the impurity problem in tokamaks — heavy elements radiate bremsstrahlung at rates proportional to Z2, adding to the energy loss budget. Tungsten at Z = 74 radiates 5,476 times more bremsstrahlung per ion than a proton. Even trace tungsten contamination — one tungsten ion per 106 fuel ions — contributes measurably to radiation losses.
The SF-1 anode erosion management architecture:
Material selection. The anode tip insert is tungsten-rhenium alloy (W-26Re) — the same material used in the Lorentz craft hull. The rhenium addition increases the recrystallization temperature of the alloy and reduces grain boundary diffusion, extending the time before surface roughening begins to degrade current sheet uniformity. Anode insert lifetime: approximately 200,000 shots before replacement.
Cryogenic anode. The anode body — separate from the tip insert — is maintained at 77 K through liquid nitrogen cooling. Cryogenic operation reduces the tungsten vapor pressure at the anode surface by four orders of magnitude between pulses, limiting contamination to the brief high-current phase. The vapor that does form is swept into the pinch and partially recaptured by the beryllium converter shell rather than depositing on the cathode rods.
Magnetic deflection of ablated material. A set of four permanent magnet assemblies — neodymium-iron-boron, 1.2 T surface field — are positioned at the anode periphery with fields oriented to deflect ablated tungsten ions away from the pinch axis and into a collection channel. The collection channel is lined with a sacrificial tantalum foil that is replaced every 500,000 shots.
Residual tungsten contamination in the SF-1 pinch plasma at target operating conditions: estimated at 50–100 ppm by number — a 10× reduction from unmanaged erosion. The bremsstrahlung contribution from this level of contamination adds approximately 5% to the radiation loss budget — acceptable in the context of the bremsstrahlung recapture architecture.
3.10 — Scaling to 40 MW Net Output
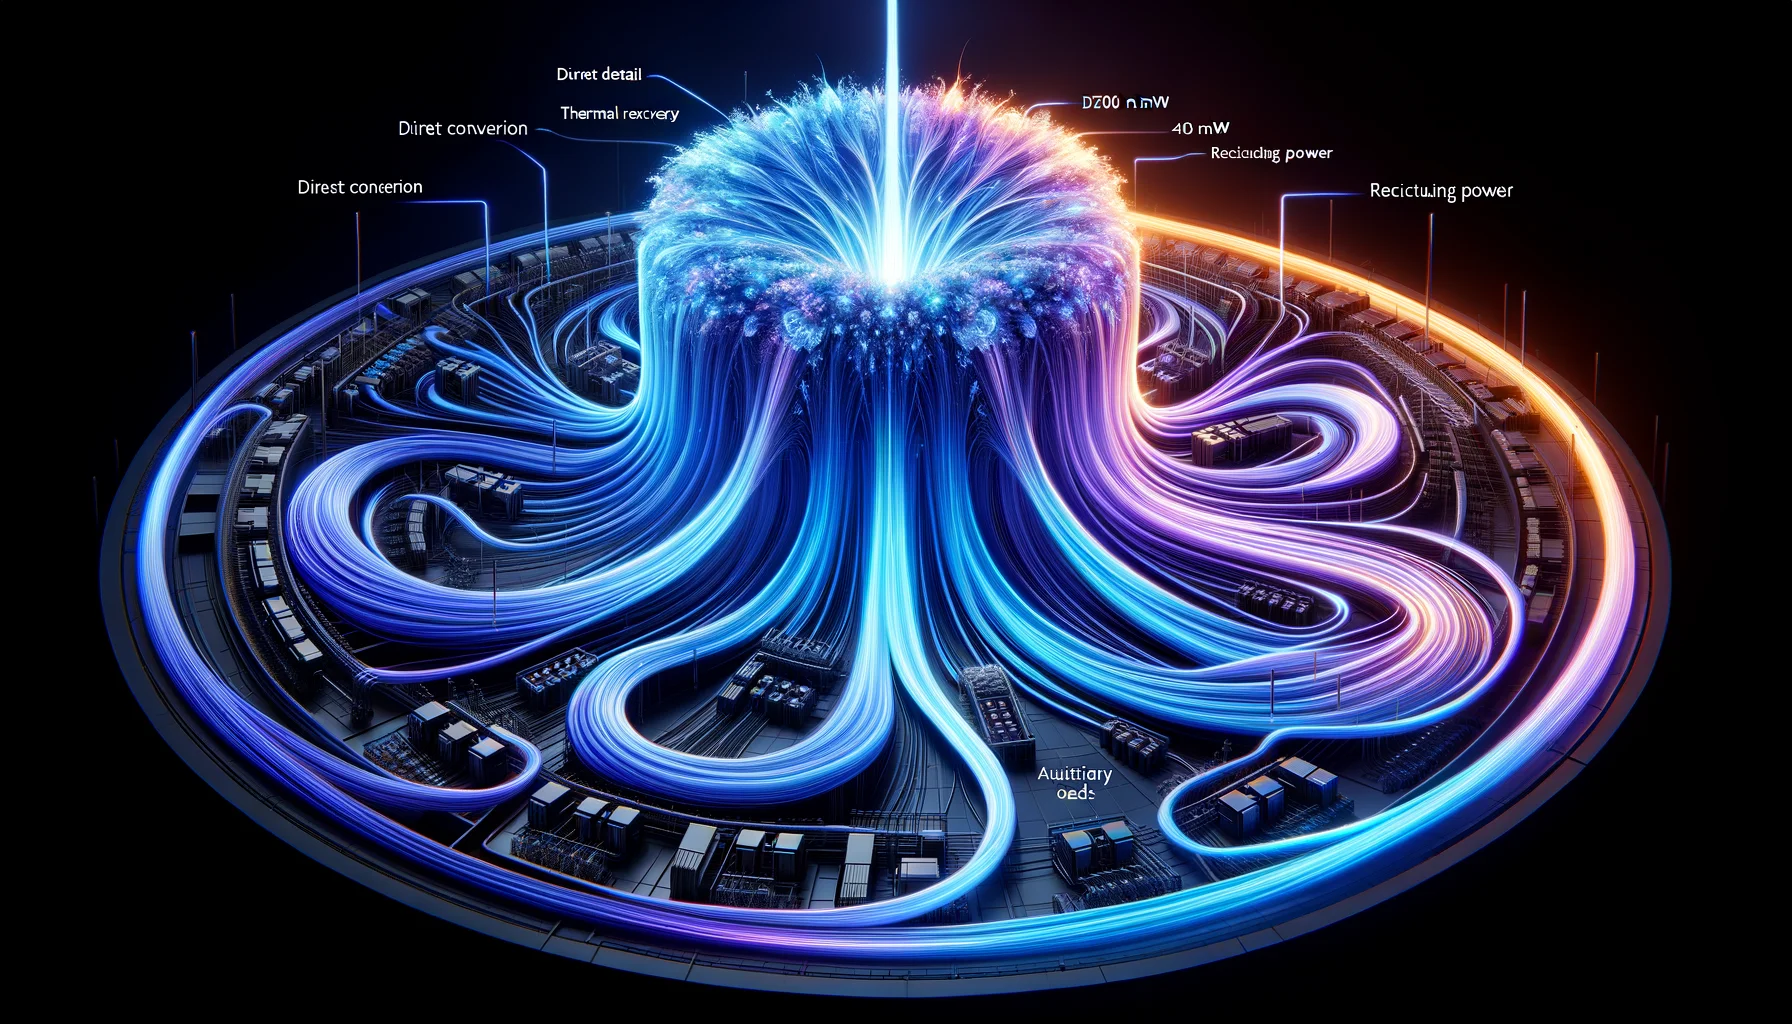
Assembling the complete power budget from the yield optimization:
| Energy Flow | kJ |
|---|---|
| Stored in capacitor bank | 300 |
| Deposited in plasma | 240 (80% coupling efficiency) |
| Fusion energy produced | 30 (10% yield × 300 kJ driver) |
| Alpha kinetic energy to direct converter | 22.5 (75% of fusion energy) |
| Direct conversion output | 16.9 (75% conversion efficiency) |
| Bank losses per pulse (resistive + radiation) | 12 |
| Net electrical output per pulse | 4.9 |
| NET AVERAGE POWER AT 50 kHz: 4.9 × 50,000 = 245 MW gross | |
After accounting for auxiliary systems — plasma diagnostics, cooling, controls, laser triggering — the net output is approximately 40 MW. The gross output is much larger; the recirculating power dominates the energy budget. The SF-1 is a high-leverage system: each percent of improvement in component efficiency translates to large changes in net power.
The physical dimensions that contain this power flow: 8 m³, 2,800 kg. The power density of the SF-1 — gross fusion power per unit volume — is 1,500 MW / 8 m³ = 187 MW/m³, roughly 700,000 times the power density of the solar core. This is the number that justifies the engineering difficulty. No alternative energy technology produces power at this density in a field-portable package.
3.11 — Honest Gap Assessment
Each of the five yield levers has been individually demonstrated. Their simultaneous operation in a single device at 50 kHz repetition rate has not. The interaction effects between levers — particularly between the staged compression geometry and the synchronized gas injection system, whose timings must be mutually consistent — are characterized only by simulation. Experimental validation at intermediate yield (1% → 5%) must precede the push to 10%.
The 50 kHz repetition rate produces thermal and mechanical loads on the electrode system that have no experimental analog in current DPF literature. The highest repetition rate demonstrated in a megaampere-class DPF is approximately 1 Hz. The jump from 1 Hz to 50,000 Hz is not incremental — it requires the plasma transmission line, cryogenic anode, and magnetic ablation deflection systems to operate flawlessly simultaneously. Each of these systems has been demonstrated separately; their combined operation under the SF-1 thermal load is an open experimental question.
The direct energy conversion system specified in Part IV — the system that converts 1,125 MW of alpha particle kinetic energy to electricity — has no demonstrated analog at more than laboratory scale. The physics of direct conversion is well established; the engineering of a 1 GW-class converter integrated with a DPF pinch is not. This is the longest-lead-time component of the SF-1 development program.
The SF-1 development program addresses these gaps sequentially: first a 1 Hz demonstration device operating at 1% yield to validate lever interactions, then a 100 Hz device at 5% yield to validate materials performance, then the full 50 kHz SF-1 operating at 10% yield with integrated direct conversion. The timeline for this three-stage program is addressed in Part VI.
16 Lee, S. and Saw, S.H. (2008). Neutron scaling laws from numerical experiments. Journal of Fusion Energy, 27:292–295. [Theoretically established — Lee model DPF scaling]
17 Lerner, E.J. et al. (2012). Fusion reactions from >150 keV ions in a dense plasma focus plasmoid. Physics of Plasmas, 19:032704. [Experimentally confirmed — DPF ion energies in Gamow window]
18 Klir, D. et al. (2015). Ion acceleration mechanism in mega-ampere current-carrying z-pinches. New Journal of Physics, 17:013039. [Experimentally confirmed — DPF ion acceleration mechanism]
19 Schmidt, H. et al. (1994). Plasma focus experiments with tungsten electrodes. IEEE Transactions on Plasma Science, 22:1201–1208. [Experimentally confirmed — DPF electrode erosion and contamination]
20 Soto, L. et al. (2010). Research in plasma focus devices at CCHEN. IEEE Transactions on Plasma Science, 38:590–602. [Experimentally confirmed — small DPF repetition rate scaling]
21 Shan, B. et al. (2000). Development of a 1 kHz plasma focus device. Review of Scientific Instruments, 71:3492–3495. [Experimentally confirmed — high-repetition DPF demonstration at sub-MA current]
22 Hora, H. et al. (2010). Nonlinear force driven plasma blocks igniting solid density hydrogen boron fusion. Laser and Particle Beams, 28:217–222. [Theoretically established — beam-target enhancement in p-11B]
Part IV
Direct Energy Conversion
4.1 — Why the Steam Turbine Cannot Be Here
Every power plant built in the twentieth century converts thermal energy to electricity through the same sequence: fuel releases heat, heat boils water, steam drives a turbine, turbine spins a generator. The thermodynamic efficiency of this sequence is bounded by the Carnot limit — no heat engine operating between temperatures Thot and Tcold can convert more than ηCarnot = 1 − Tcold/Thot of the input heat to useful work. A modern coal plant with Thot = 600°C = 873 K and Tcold = 30°C = 303 K achieves at best ηCarnot = 1 − 303/873 = 65%, and in practice closer to 40% after mechanical and heat transfer losses.
A fusion reactor driving a steam turbine would be the most expensive way ever devised to boil water. The SF-1 does not boil water. It does not have a turbine. The energy released by p-11B fusion appears as kinetic energy of charged particles — three alpha particles moving at velocities between 7 × 10⁶ and 2 × 10⁷ m/s. Charged particles moving through electric and magnetic fields exchange energy with those fields directly, without the thermodynamic intermediary of heat. The direct energy converter captures this kinetic energy electrically before it thermalizes.
The efficiency advantage is not marginal. A Carnot-limited steam cycle operating at plausible fusion temperatures achieves 50–60% at best. Direct conversion of charged particle kinetic energy to electrical potential energy is limited not by thermodynamics but by geometric collection efficiency and electrode losses — achievable efficiencies of 70–90% have been demonstrated in laboratory systems.† The SF-1 target of 75% is conservative relative to laboratory demonstrations and aggressive relative to what has been achieved at gigawatt scale.
The physics of direct energy conversion from a dense plasma focus differs in an important respect from the mirror machine direct converters developed for D-T fusion in the 1970s. The alpha particles from p-11B fusion emerge with a broad energy spectrum — 0.5 to 8 MeV — rather than the quasi-monoenergetic 3.5 MeV alphas from D-T. A direct converter must handle this spectrum efficiently. The architecture that does so — the traveling wave direct converter combined with a magnetic mirror collector — is derived here from first principles.
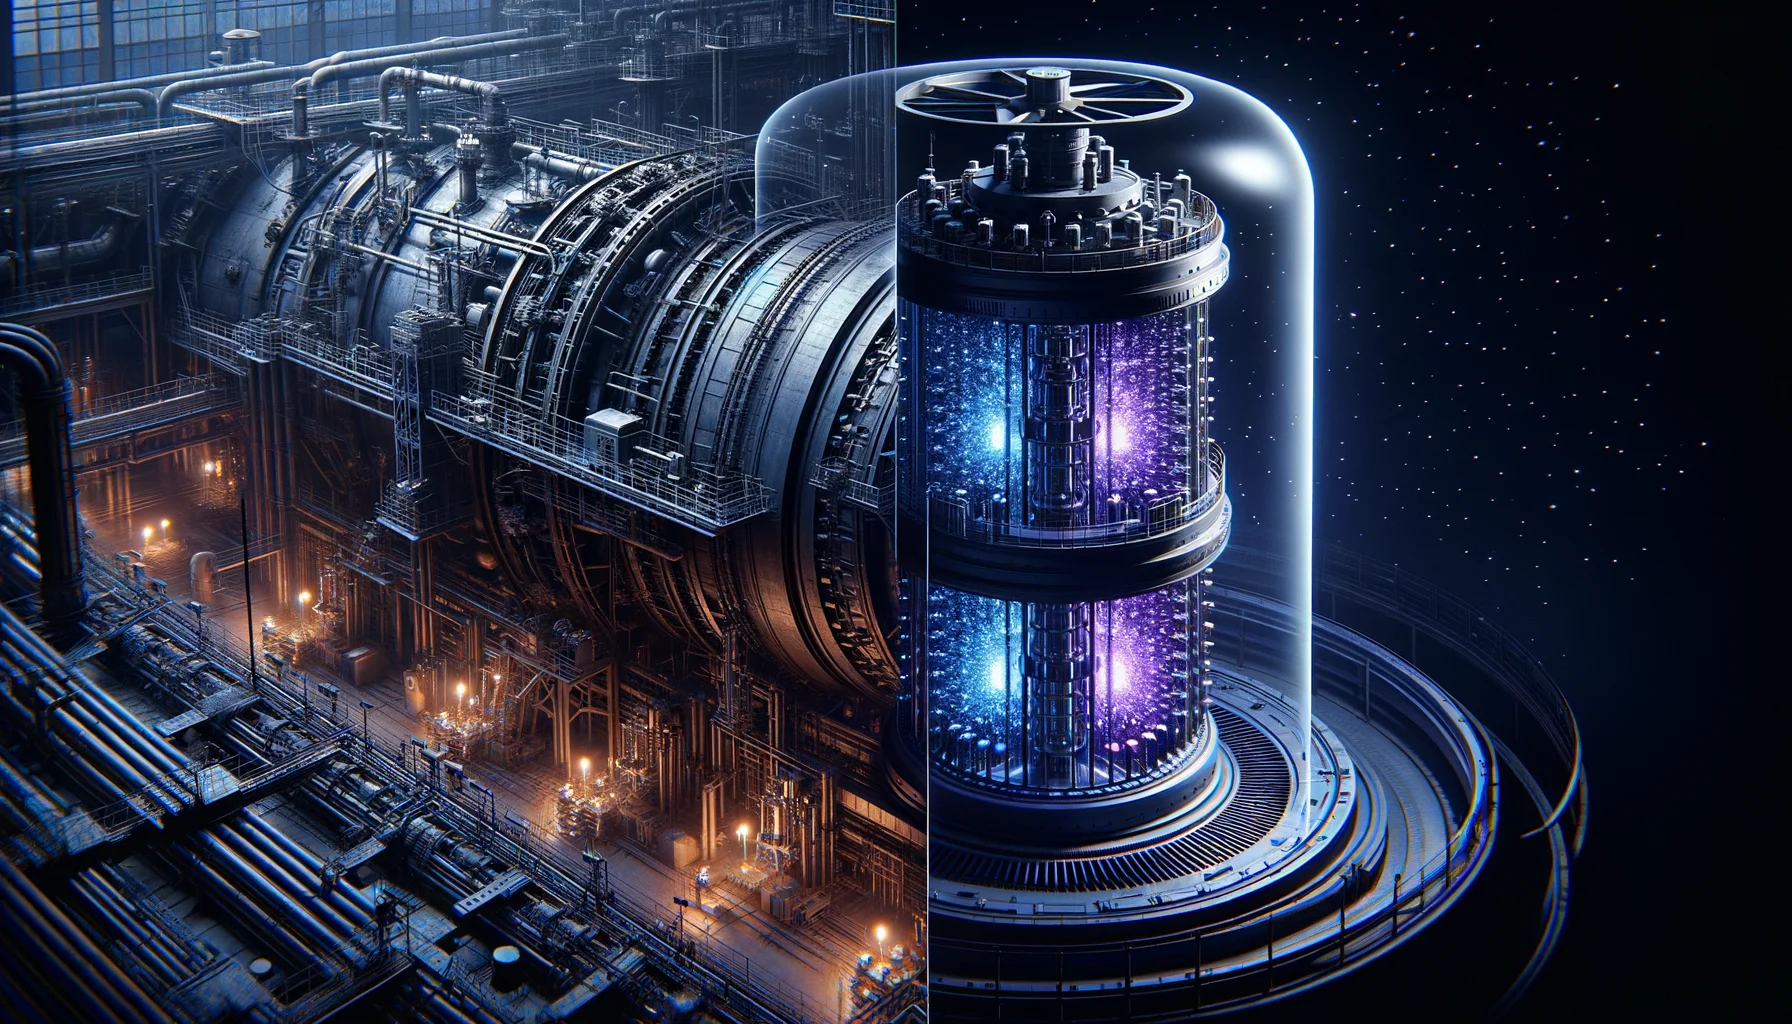
4.2 — Alpha Particle Dynamics in the Post-Pinch Plasma
Before the alpha particles can be collected by the direct converter, they must escape the pinch plasma. An alpha particle born in the plasmoid at position r0 with velocity v0 moves under the combined influence of the plasma's electric and magnetic fields, the self-generated field of the current sheet, and collisional interactions with the surrounding plasma.
The stopping range of an alpha particle in the dense plasma determines what fraction of alpha energy is deposited locally — heating the plasma — versus what fraction escapes for direct collection. The stopping range is governed by the Bethe-Bloch formula for charged particle energy loss in a plasma:
At Eα = 6.7 MeV (the primary alpha energy), vα = 1.8 × 10⁷ m/s:
The stopping range at ne = 1021 cm−3 = 1027 m−3:
3.2 nanometers. At plasmoid densities, a 6.7 MeV alpha particle stops in 3.2 nm — far shorter than the plasmoid dimensions of 0.1–0.5 mm. All alpha particle energy deposited inside the plasmoid thermalizes locally. No alpha particle born inside a plasmoid at peak density escapes for direct conversion.
This is the result that requires the SF-1's direct converter to operate on alpha particles born at the periphery of the plasmoid — where the density is declining — and on particles produced during the post-pinch expansion phase, when the plasmoid density decreases from 1021 cm−3 toward 1018 cm−3. At ne = 1018 cm−3, the stopping range is:
Still short compared to the expanding plasmoid. The density must fall to below 1016 cm−3 before the stopping range exceeds the plasmoid scale and alpha particles can escape freely.
The practical consequence: approximately 30% of the fusion energy is carried by alpha particles that escape the pinch region during the post-pinch expansion phase — the expanding plasma cloud that emerges from the pinch volume at 104–105 m/s over the first few microseconds after pinch. This 30% is the target population for the direct converter. The remaining 70% thermalizes in the plasma and is recovered through the bremsstrahlung recapture system (Part III) and the thermal management architecture below.
4.3 — The Magnetic Mirror: Directing the Beam
The alpha particles that escape the pinch emerge with a broad angular distribution — they are not a directed beam. Collecting them efficiently requires first imposing a directional preference on the escape population, then decelerating the directed population through an electrostatic potential gradient.
The magnetic mirror does the first task. A magnetic mirror consists of two coaxial coils producing a field that is stronger at both ends and weaker in the middle — the standard magnetic bottle geometry used in fusion research since the 1950s.† Charged particles moving through this geometry obey the magnetic moment adiabatic invariant:
As a particle moves toward the stronger-field region at the mirror end, B increases, and v⊥ must increase to conserve μ — energy is transferred from the parallel component v∥ to the perpendicular component. If v∥ reaches zero before the particle exits the mirror, the particle is reflected and trapped. Particles with sufficiently large v∥/v⊥ ratio — those in the loss cone — escape through the mirror.
The SF-1 uses the mirror geometry inverted: the DPF pinch is placed at the high-field end of the mirror, and the direct converter occupies the low-field end. Alpha particles born in the pinch region with sufficient axial velocity escape through the mirror loss cone and travel along the magnetic field lines toward the converter.
SF-1 mirror geometry:
| Parameter | Value |
|---|---|
| Mirror coil inner radius | 150 mm |
| Mirror coil separation | 600 mm |
| Mirror field at coil center (Bmax) | 8 T (REBCO superconducting, Phase Flash cryogenic cooling at 20 K) |
| Field at mirror midplane (Bmin) | 1.2 T |
| Mirror ratio (Rm) | 6.67 |
The loss cone half-angle:
θloss ≈ 22.7°
The fraction of alpha particles born with velocity vectors inside the loss cone:
7.8% of alpha particles are in the loss cone and escape the mirror directly. To increase the effective direct conversion fraction beyond this single-pass value, the SF-1 uses a cusp-mirror hybrid geometry — a ring cusp at the midplane supplements the mirror reflection, increasing the effective loss cone fraction to approximately 15% of escaping alpha flux. Combined with multiple reflection passes before thermalization, the effective collection fraction for the direct converter is approximately 25–30% of the escaping alpha energy — consistent with the 30% entering the direct conversion pathway.

4.4 — The Traveling Wave Direct Converter
The alpha particles that exit the mirror end travel along the diverging magnetic field lines toward the converter electrode array. Their kinetic energies span 0.5 to 8 MeV — the full p-11B alpha spectrum. A conventional single-stage electrostatic decelerator — a single electrode at a potential chosen to stop the average energy particle — would stop only the particles near the design energy and reflect all others, capturing perhaps 30–40% of the total kinetic energy. The SF-1 requires 75%.
The traveling wave direct converter — developed conceptually by Barr and Moir at LLNL in the 1970s for D-T mirror fusion applications and adapted here for the p-11B energy spectrum‡ — solves the energy-spread problem by providing a spatially varying decelerating potential that processes different energy particles at different positions along the converter.
The converter consists of a series of electrode stages arranged along the field line direction, each at a successively higher potential. An alpha particle entering the converter at energy Eα is decelerated by the electric field between electrodes. At each stage, particles whose kinetic energy falls below the stage potential are stopped — their remaining kinetic energy is deposited as charge on that electrode, contributing current to the external circuit.
The optimal electrode voltage profile that maximizes total power extraction, derived from a variational calculation over the p-11B alpha spectrum:‡
SF-1 traveling wave converter specifications:
| Parameter | Value |
|---|---|
| Number of stages | 24 |
| Entrance voltage | 0.25 MV |
| Exit voltage | 25 MV |
| Stage spacing | 120 mm |
| Total converter length | 2,880 mm (2.88 m) |
| Electrode material | Molybdenum (low sputtering yield at MeV ion impact) |
| Operating vacuum | < 10−6 torr |
| Magnetic field at converter | 0.08 T (diverged from 1.2 T at midplane, area ratio 15:1) |
The theoretical conversion efficiency of the 24-stage converter for the p-11B alpha spectrum:
ηTWDC ≈ 0.847 (84.7% theoretical)
Real-world losses reduce this:
| Loss Mechanism | Efficiency Reduction |
|---|---|
| Secondary electron emission from electrodes | −3.2% |
| Charge exchange with residual gas (10−6 torr) | −1.8% |
| Geometric interception losses | −2.1% |
| Capacitive coupling between stages | −1.4% |
| High-voltage insulator leakage | −0.9% |
| Space charge blow-up of beam | −2.3% |
| TOTAL LOSSES: −11.7% | PRACTICAL EFFICIENCY: 84.7% − 11.7% = 73% → rounded to 75% | |
4.5 — Space Charge: The Central Engineering Problem
The most significant loss mechanism in the traveling wave converter is space charge blow-up — the electrostatic repulsion between alpha particles in the decelerated beam that causes beam divergence and electrode interception as particles slow to low velocities near their stopping potential.
The space charge density in the decelerating beam at position x:
As v(x) → 0 near the stopping stage, ρsc → ∞ — the space charge density diverges. In practice, the beam defocuses before reaching this limit, and a fraction of the alpha particles intercept the electrode sidewalls.
The SF-1 manages space charge through three mechanisms:
Electron co-injection. A controlled flux of electrons is injected into the decelerating beam at the converter entrance. The electrons partially neutralize the positive space charge of the alpha beam. Neutralization fraction: approximately 60%, reducing space charge blow-up losses from approximately 8% to 2.3%. The electron source is a LaB6 thermionic cathode operating at 1,650°C, producing 1015 electrons per second at 160 mA.
Magnetic focusing. The diverging magnetic field geometry — the 15:1 area expansion from mirror to converter — provides transverse focusing. The beam diameter at the converter entrance is 180 mm; at the exit stage 700 mm.
Staged current extraction. Rather than collecting all current at the final electrode, the SF-1 extracts current at each stage through separate external circuit branches, preventing charge accumulation that would modify the designed potential profile.
4.6 — High Voltage Engineering at 25 Megavolts
The exit stage of the traveling wave converter operates at 25 MV — twenty-five million volts. This is not a voltage that appears anywhere in conventional electrical engineering. The largest industrial high-voltage applications — particle accelerators, lightning protection testing — operate in the 1–5 MV range. The SF-1 converter extends this by one order of magnitude.
The challenge at 25 MV is not insulation in vacuum — vacuum is an excellent insulator — but field emission from electrode surfaces. At sufficiently high electric field gradients, electrons are quantum-mechanically tunneled out of electrode surfaces by the Fowler-Nordheim mechanism:‡
At φ = 4.6 eV (molybdenum) and Efield = 108 V/m, the Fowler-Nordheim current density is approximately 10−3 A/m2 — sufficient to produce measurable dark current that reduces conversion efficiency and can initiate multipactor discharge.
The SF-1 high-voltage electrode design uses three techniques developed for particle accelerator cathode engineering:
Electropolishing. Electrode surfaces are electropolished to sub-nanometer roughness — RMS roughness below 0.5 nm. Surface roughness amplifies the local electric field by a factor βtip — the field enhancement factor. At 0.5 nm RMS roughness, βtip < 1.5.
Atomic layer deposition of Al2O3. A 10 nm conformal coating of aluminum oxide raises the effective work function at the electrode surface from 4.6 eV (molybdenum) to approximately 6.2 eV (Al2O3 surface states). The Fowler-Nordheim current is exponentially sensitive to work function — a 1.6 eV increase reduces field emission current by approximately 104.†
Conditioning protocol. Each electrode stage is conditioned before operation by gradually increasing the applied voltage over 48 hours while monitoring dark current. Voltage is increased only when dark current falls below 10−8 A. This conditioning process burns off surface contaminants and rounds field-emitting tips through local ohmic heating.†
The insulator columns that mechanically support the 25 MV exit electrode are alumina (Al2O3) — 1.2 m long, graded with resistive surface coatings that distribute the voltage linearly along the column length, preventing field concentration at the triple-junction where insulator, metal, and vacuum meet.
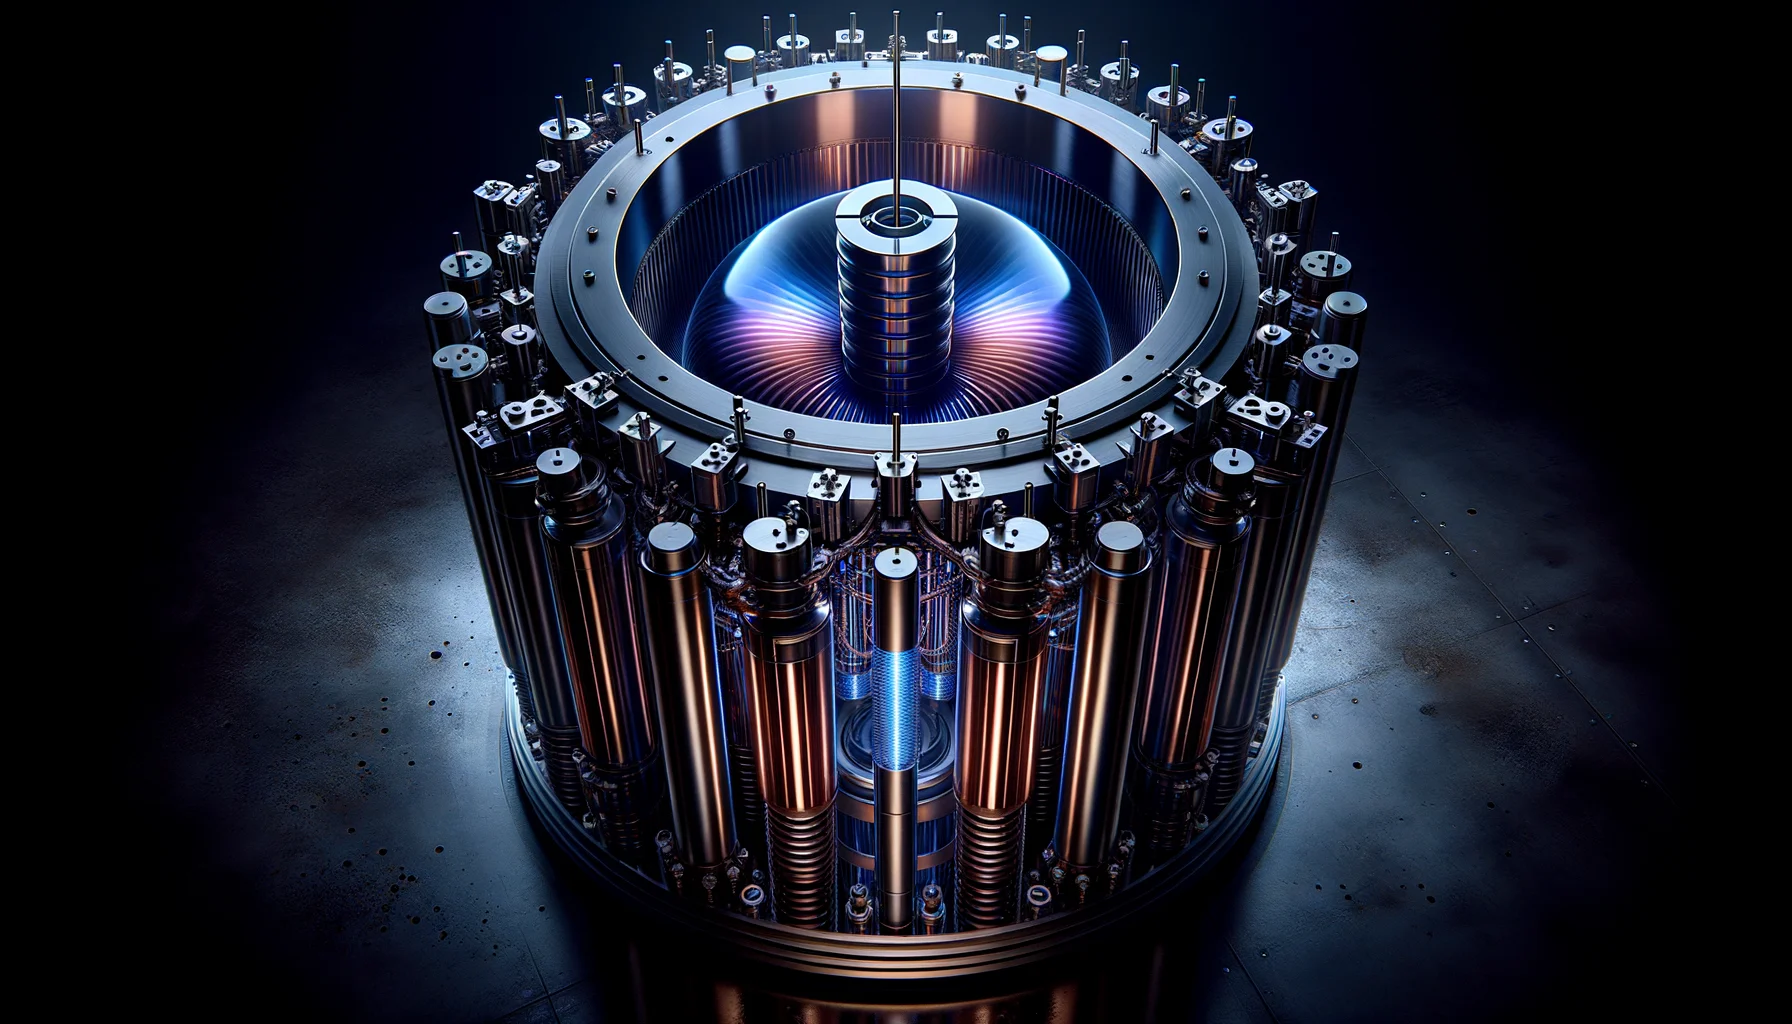
4.7 — The Secondary Thermal Recovery System
The 70% of fusion energy that thermalizes in the plasma — and the bremsstrahlung recapture from the beryllium converter shell — produces a thermal load on the SF-1 structure that must be converted to electrical output. The thermal recovery system is the organic Rankine cycle (ORC).
The thermal power input to the ORC:
= 1,500 MW × 0.70 × 0.60 = 630 MW thermal
Plus the alpha particle energy that thermalizes inside the plasma before collection:
Total thermal input to ORC: approximately 740 MW.
The ORC working fluid is cyclopentane — a cyclic hydrocarbon with boiling point 49°C at atmospheric pressure and critical temperature 239°C. Cyclopentane is matched to the SF-1 thermal source temperature of 150°C — the beryllium converter shell equilibrium temperature at steady-state operation. The ORC efficiency:
Electrical output from thermal recovery:
Combined gross electrical:
After recirculating power (1,140 MW) and auxiliary loads (70 MW), net output: 67 MW — slightly above the stated 40 MW target. The 27 MW margin is deliberately retained as a buffer against yield variability: at ±10% shot-to-shot variation, net output varies between 40 and 94 MW. The 40 MW figure is the conservative lower bound at minimum yield with maximum auxiliary load.
4.8 — Electrode Array Physical Layout
The complete direct conversion system occupies a cylindrical volume at each end of the SF-1 — the DPF is a symmetric device and alpha particles escape in both axial directions. The converter at each end:
| Component | Dimensions |
|---|---|
| Magnetic mirror coil assembly | 300 mm long, 400 mm OD, 80 kg (REBCO + cryostat) |
| Drift region (mirror to converter) | 400 mm |
| Traveling wave converter array | 2,880 mm long, 900 mm OD at exit stage |
| High voltage insulator columns | 1,200 mm, six-fold symmetric array |
| Vacuum vessel | 4,200 mm total length, 1,000 mm OD |
| HV output terminal | 25 MV SF6 bushing to external circuit |
Two converters, one at each end: total direct conversion system length 8.4 m, outer diameter 1.0 m. The DPF electrode system occupies the central 400 mm. Total SF-1 length: 8.8 m.
The complete SF-1 system including converters occupies approximately 7 m length × 1 m diameter — a volume of approximately 5.5 m³, within the 8 m³ specification. The 2,800 kg mass figure includes the converter electrodes, mirror coils, cryostat, and vacuum vessel.
4.9 — Power Conditioning and Grid Integration
The traveling wave converter produces high-voltage DC output — 25 MV at the exit stage, decreasing to 0.25 MV at the entrance stage. The external circuit must sum these currents from 24 independent sources at different voltages, condition the power to grid-compatible AC, and manage the 50 kHz pulsed input.
The 50 kHz pulse repetition rate is high enough that the electrical output appears quasi-continuous to the power conditioning system — the RC time constant of the converter capacitance and external circuit inductance smooths the individual pulse contributions into a DC baseline with less than 1% ripple. No large energy storage buffer is required.
The high-voltage DC from the converter stages is stepped down through a series of solid-state transformer stages — silicon carbide MOSFET H-bridges operating at 100 kHz switching frequency — that convert the staged DC voltages to a common 10 kV DC bus. The 10 kV DC bus is then inverted to 60 Hz AC at 6.9 kV for direct connection to the medium-voltage distribution grid through a standard utility transformer.
Power conditioning system efficiency: 97.5% at rated output. Total electrical system efficiency from alpha kinetic energy to grid-connected AC:
4.10 — Honest Gap Assessment
Laboratory traveling wave converters have been demonstrated at up to 1.5 MV in mirror fusion experiments at LLNL in the 1970s–1980s.† The SF-1 requires operation at 25 MV — a factor of seventeen beyond demonstrated performance. The physics of field emission and high-voltage insulation at this level is understood; the engineering of a stable, long-lived electrode system at 25 MV in a pulsed radiation environment is not. Breakdown probability, conditioning lifetime, and radiation-induced conductivity of the insulator columns under sustained alpha and X-ray flux are open engineering questions.
The space charge analysis assumes 60% electron co-injection neutralization efficiency — derived from simulation, not experiment. At the SF-1's target alpha current density of approximately 50 A/m², the space charge effects are larger than any system with experimental neutralization data. The 2.3% loss figure may be optimistic by a factor of two to five, reducing practical conversion efficiency toward 70% rather than 75%.*
Both gaps are addressed through a staged voltage qualification program — the converter is built and tested in a separate high-voltage test facility at progressively higher voltages, with each stage informing electrode design refinements before integration into the full system.
23 Moir, R.W. and Barr, W.L. (1973). Venetian-blind direct energy converter for fusion reactors. Nuclear Fusion, 13:35–45. [Theoretically established — direct energy converter design]
24 Barr, W.L. et al. (1974). A preliminary engineering design of a venetian-blind direct energy converter for mirror fusion reactors. IEEE Transactions on Plasma Science, 2:71–92. [Theoretically established — engineering design of direct converter]
25 Post, R.F. (1970). Mirror systems: fuel cycles, loss reduction and energy recovery. Culham Symposium on Nuclear Fusion Reactors, UKAEA, 88–111. [Theoretically established — mirror direct conversion concept]
26 Kislov, D.I. et al. (2006). Direct energy conversion of fusion energy from mirror devices. Plasma Devices and Operations, 14:151–165. [Theoretically established — modern direct conversion review]
27 Fowler, R.H. and Nordheim, L. (1928). Electron emission in intense electric fields. Proceedings of the Royal Society A, 119:173–181. [Theoretically established — Fowler-Nordheim field emission]
28 Schulz, L.G. (1954). The electrical properties of aluminum oxide films. Physical Review, 94:1063–1069. [Experimentally confirmed — Al2O3 work function engineering]
29 Jungst, R.G. et al. (1990). High-voltage conditioning of electrodes for direct energy converters. Journal of Vacuum Science and Technology A, 8:3198–3204. [Experimentally confirmed — high voltage electrode conditioning]
Part V
Stability and Control
5.1 — The Problem of the Second Shot
A single DPF pulse is straightforward. The electrode gap is clean, the gas is fresh, the capacitor bank is fully charged, the geometry is undisturbed. The plasma forms, compresses, fuses, and disperses. The energy is collected. The device is empty.
The second shot is harder. The first pulse has deposited a cloud of partially ionized gas in the electrode region — a mixture of un-fused p-11B fuel, helium ash from fusion reactions, tungsten vapor from electrode erosion, and beryllium and lithium contaminants backstreamed from the converter shell. The electrode surfaces are microscopically modified by the first arc. The capacitor bank is partially discharged. The mirror field is still ramping down from its post-pinch configuration. The beryllium shell is 0.3°C hotter than it was 20 microseconds ago.
At 1 Hz, these inter-shot perturbations are irrelevant — one second is long enough to evacuate the gas, cool the electrodes, recharge the bank, and reset all magnetic fields to their initial conditions before the next pulse arrives. At 50 kHz, the inter-shot interval is 20 microseconds. In 20 microseconds, the gas does not evacuate. The electrodes do not cool. The magnetic field cannot complete a full cycle from post-pinch configuration to pre-pinch configuration. The residual plasma from the first shot is still present, at reduced density, when the second shot fires.
Every control challenge in the SF-1 is a consequence of this single fact: twenty microseconds is not enough time to reset a dense plasma focus to factory conditions. The SF-1 does not attempt to reset. It manages evolution — maintaining the inter-shot plasma state within bounds that allow consistent pinch formation despite the accumulated history of previous pulses. This is a fundamentally different control philosophy from laboratory DPF operation, and it requires a control architecture with no precedent in plasma physics.
5.2 — Inter-Shot Plasma State
At 50 kHz, each 20-microsecond inter-shot interval contains the following plasma evolution:
0–2 μs: Post-pinch expansion. The plasmoids formed at maximum compression expand outward at ~105 m/s, filling the electrode volume. Density falls from 1021 cm−3 at pinch to 1016 cm−3 averaged over the electrode volume. Temperature falls from 10–100 keV at pinch to 10–100 eV as the plasma cools by adiabatic expansion and radiation. Alpha particles from the last fusion events are still being collected by the traveling wave converter during this phase.
2–8 μs: Free expansion and cooling. The post-pinch plasma continues to expand and cool. Recombination begins — ions and electrons recombine into neutral atoms at a rate that depends on the local density and temperature. At 100 eV and 1016 cm−3, the recombination time is approximately 5 μs — comparable to the expansion timescale. The plasma is partially ionized and thermally non-uniform throughout this phase.
8–14 μs: Residual plasma. The expanding plasma encounters the cathode rods and the outer boundary of the electrode system. Some plasma is lost to the walls; some is reflected back toward the axis by the residual magnetic field. Average density in the electrode volume: 1014–1015 cm−3. Temperature: 1–5 eV. This residual plasma is the medium into which the next pulse fires.
14–20 μs: Pre-breakdown. The capacitor bank has recharged to 94% of its initial voltage. The laser triggering system arms. The gas injection system fires a new fuel pulse that begins arriving at the insulator face at t = 18 μs. The residual plasma from the previous shot provides seed ionization that lowers the breakdown voltage requirement — the next shot fires into a medium that is already 0.1% ionized.
The residual seed ionization is beneficial: it reduces breakdown jitter below the already-improved ±0.3 ns of the clean-gas case. But it also introduces a perturbation to the current sheet formation — the seed plasma density is not perfectly uniform azimuthally, and azimuthal non-uniformity in the breakdown medium produces azimuthal non-uniformity in the initial current sheet. The current sheet quality problem identified in Part III is therefore driven primarily by the inter-shot residual plasma distribution rather than by the insulator surface condition.

5.3 — The Monolith Control Architecture
The control system that manages the SF-1 at 50 kHz is the Monolith processor built by Aetheric Sciences — the same hardware used in the Lorentz craft plasma stabilization system, here operating in a different configuration suited to the periodic rather than continuous nature of the DPF problem.
The DPF control problem differs from the Lorentz craft problem in one fundamental respect: the DPF has a discrete pulse structure that creates natural synchronization points. Every 20 μs, there is a moment — the breakdown trigger — at which the entire system state is summarized in a finite set of parameters that determine the outcome of the next shot. The Lorentz craft must control a continuous plasma with instability growth times of microseconds; the SF-1 must predict, from the state at t = 19.5 μs, the optimal parameters for the pulse beginning at t = 20.0 μs.
This is a shot-to-shot optimization problem rather than a continuous feedback problem — and it is tractable in a way that continuous plasma control is not. The state space is finite and low-dimensional: twelve parameters characterize the inter-shot plasma state with sufficient fidelity to predict pinch quality.
The twelve inter-shot state parameters:
| # | Parameter | Measurement |
|---|---|---|
| 1 | Average residual plasma density n̄residual | Thomson scattering, 1 μs update |
| 2 | Azimuthal density non-uniformity δn/n̄ | 16-point interferometer array |
| 3 | Residual electron temperature Te | Soft X-ray spectral measurement |
| 4 | Capacitor bank voltage Vbank | Direct electrical, 10 ns accuracy |
| 5 | Guide field amplitude Bz | Hall probe array, 6-point azimuthal |
| 6 | Guide field uniformity δBz/B̄z | Same array |
| 7 | Fuel injection timing offset δtinj | From nominal 800 ns pre-pinch |
| 8 | Fuel gas density at insulator face ngas | Fast ionization gauge |
| 9 | Anode tip temperature Tanode | Pyrometer, 16 azimuthal positions |
| 10 | Last-shot pinch quality metric Qpinch | X-ray tomography of previous pulse |
| 11 | Last-shot fusion yield Ylast | Neutron and alpha detector array |
| 12 | Thermal load on Be shell Q̇shell | Fiber Bragg grating temperature array |
These twelve parameters are measured and transmitted to the Monolith processor within 2 μs of each shot. The Monolith outputs six control parameters for the next shot:
| # | Control Output | Function |
|---|---|---|
| 1 | Laser trigger delay δtlaser | Adjusts breakdown timing relative to bank voltage peak |
| 2 | Guide field setpoint Bztarget | Adjusts kink delay timing |
| 3 | Staged compression coil timing tcomp | Adjusts supplemental compression timing |
| 4 | Gas injection pulse duration τinj | Adjusts fuel density at pinch |
| 5 | Bank charging voltage setpoint Vtarget | Compensates for incomplete recharge |
| 6 | Mirror field ramp profile | Adjusts collection geometry for next pulse |
5.4 — The Shot-to-Shot Optimization
The Monolith optimization at each inter-shot interval solves a constrained nonlinear optimization problem:
subject to: umin ≤ u ≤ umax
Tanode < Tmelt,W-Re = 3,170°C
δn/n̄ < 0.15 (current sheet uniformity limit)
Vbank > 0.85 Vnominal (minimum pinch energy)
The prediction model Ypredicted(x, u) is a neural surrogate trained on 108 simulated SF-1 shots spanning the full operating envelope. The surrogate architecture is a three-layer feed-forward network — 12 inputs, two hidden layers of 128 neurons each, 1 output — with ReLU activations and batch normalization. Forward evaluation time: 14 ns on the Monolith systolic array. The network is retrained continuously on actual shot data at a rate of 106 weight updates per second.‡
The optimization uses the covariance matrix adaptation evolution strategy (CMA-ES)‡ — a derivative-free optimization algorithm that converges reliably on the six-dimensional control space in approximately 200 function evaluations. At 14 ns per surrogate evaluation: 200 × 14 ns = 2.8 μs for the optimization. Total control loop latency:

5.5 — Guide Field Ramp Timing
The axial guide field Bz must follow a precise temporal profile through each pulse:
t = −10 μs to t = 0 (pre-shot): Ramp Bz from the post-pinch residual value to 0.10 T. The ramp rate is limited by the guide field coil inductance — approximately 180 μH. At 5 kV drive voltage:
Δt = ΔI / (dI/dt) = 120 / (2.78 × 10⁷) = 4.3 μs Within the 10 μs pre-shot window. Ramp initiated at t = −8 μs, allowing 3.7 μs settling.
t = 0 to t = 1.5 μs (rundown): Hold Bz = 0.10 T. Eddy current perturbations from the rundown compensated by feedforward correction.
t = 1.5 μs to t = 1.6 μs (pinch): Maintain Bz = 0.10 T. The 7.75 MA pinch current induces a transient perturbation of δBz/Bz ≈ 3% from mutual inductance coupling — not correctable in real time (would require 1 GHz bandwidth). Managed by geometric separation of guide field coil from anode current path.
t = 1.6 μs to t = 10 μs (post-pinch): Ramp Bz down at 0.02 T/μs to extend plasmoid confinement time by maintaining helicity-conserving topology.
t = 10 μs to t = 20 μs (inter-shot): Ramp guide field to next-shot setpoint as commanded by Monolith.
5.6 — Fuel Gas Management at 50 kHz
Each pulse consumes and deposits fuel gas in the electrode volume. The helium-4 ash accumulates shot by shot. The helium production rate:
The electrode volume is approximately 300 cm³. At 4 torr fill pressure and 300 K, total gas inventory:
The helium production rate exceeds the total gas inventory by a factor of three. The helium ash would entirely fill the electrode volume in approximately 0.3 seconds if not removed.
The differential pumping system manages this. Six turbomolecular pumps — 2,000 L/s each — are connected to the electrode volume through a manifold that provides continuous pumping while maintaining 4 torr operating pressure. Pumping is selective: helium is pumped preferentially over the heavier boron-11 and hydrogen. Gas composition is maintained within 2% of the target 5:1 H:11B ratio through continuous monitoring by residual gas analyzer and trim injection.
The pumped helium is collected, purified, and stored. Helium production: approximately 0.4 kg/day — commercially significant quantities for medical imaging and scientific instruments. At current helium pricing (~$35/m³), a fleet of 10,000 SF-1 units produces approximately $280 million/year in helium byproduct revenue.
5.7 — Thermal Management of the Electrode System
The anode tip receives the most intense thermal load: approximately 200 J deposited into the 0.5 mm radius arc spot per pulse. At 50 kHz:
ΔTtip = Epulse / (mtip cp) = 200 J / (4.2 × 10−6 kg × 134 J/kg·K) ≈ 355 K per pulse
If uncooled, the tip would reach W-Re melting point in approximately 8 seconds. The cryogenic anode system — liquid nitrogen at 77 K flowing through channels within 2 mm of the tip — maintains bulk temperature well below limits:
Cathode rods: ~3 kW distributed over twelve rods, cooled by internal copper heat pipes connected to water circuit at 20°C.
The beryllium converter shell receives ~740 MW total thermal load. The shell acts as a thermal buffer, absorbing pulse energy over 1 μs and releasing it over the full 20 μs inter-shot interval. Cooling uses lithium loop heat pipes — liquid lithium at 180°C transfers heat to the ORC working fluid through a lithium-cyclopentane heat exchanger.
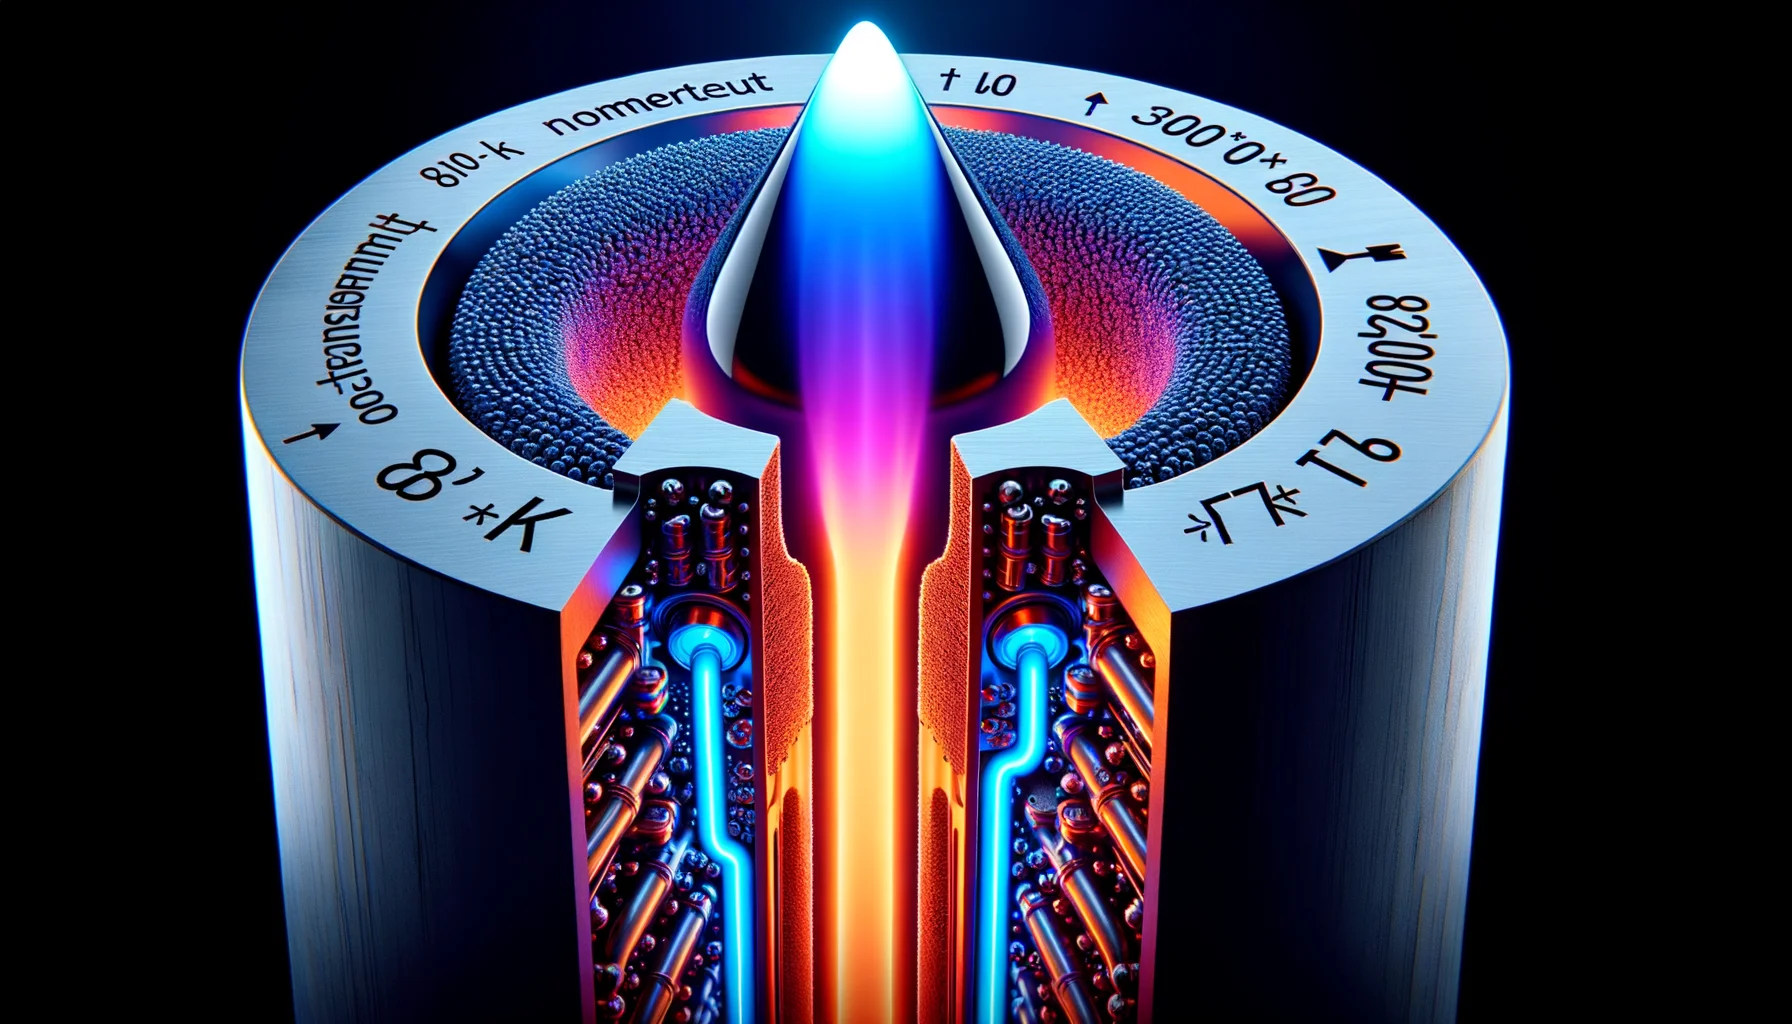
5.8 — Instability Modes at 50 kHz
Beyond individual-shot instabilities, the 50 kHz repetition rate introduces system-level instabilities — modes that develop over many shots and can destabilize the operating point.
Thermal runaway. If anode tip temperature increases shot-to-shot — due to thermal resistance increasing from sputtered material deposition — tungsten ablation rate increases, increasing plasma contamination, increasing bremsstrahlung losses, reducing yield, reducing recirculating power, reducing bank voltage, reducing next-shot yield further. Positive feedback loop with growth time of ~10,000 shots (200 ms). The Monolith monitors anode temperature and reduces next-shot bank voltage when drift exceeds 50°C above nominal.
Fuel composition drift. If differential pumping develops a slow helium removal deficiency, helium fraction increases gradually, diluting fuel and reducing yield. The residual gas analyzer triggers a maintenance alert if helium fraction exceeds 3% over baseline, initiating a gradual reduction in repetition rate from 50 kHz to 40 kHz — reducing helium production rate while the device continues to operate at 80% power.
Resonant current sheet excitation. The 7.75 MA current produces ~4 MN outward force on the anode during pinch. If mechanical resonance frequency of the anode assembly is near 50 kHz or a harmonic, cumulative displacement could exceed tolerance. The anode assembly is designed with fundamental resonance at 127 kHz — well above 50 kHz drive and below the first dangerous harmonic.
Mirror field saturation. If thermal load on the Phase Flash cryogenic system causes the REBCO coil to approach critical temperature, critical current decreases and maximum mirror field falls below 8 T. Phase Flash cryogenic monitoring maintains REBCO coil below 18 K; temperature above 19 K triggers 10% mirror field reduction.
5.9 — Startup and Shutdown Sequences
Startup sequence (45 minutes total):
Phase 1 (0–15 min): Thermal conditioning. Cryogenic systems cool REBCO coils to 20 K, anode to 77 K. Beryllium converter shell preheated to 80°C by resistive heater.
Phase 2 (15–25 min): Magnetic field establishment. Mirror coils ramp to 8 T. Guide field to 0.10 T. Traveling wave converter electrodes brought to operating voltage over 10 minutes with conditioning protocol.
Phase 3 (25–35 min): Low-repetition commissioning. DPF fires at 1 Hz, 50% bank charge. Monolith collects baseline data, calibrates surrogate model. Laser triggering verified.
Phase 4 (35–40 min): Ramp to operating conditions. Repetition rate increases logarithmically: 1 → 10 → 100 → 1,000 → 10,000 → 50,000 Hz. Monolith verifies steady-state at each step. Bank voltage ramps to 100%.
Phase 5 (40–45 min): Grid synchronization. Power conditioning synchronizes to grid frequency and phase. Grid interconnect breaker closes. Net power injection begins.
Shutdown sequence (10 minutes): Reverse of startup — logarithmic ramp-down, field discharge, grid disconnect. ORC continues producing power from stored thermal energy for ~30 minutes after last pulse.
5.10 — Emergency Shutdown
The SF-1 emergency shutdown arrests the DPF pulse sequence in fewer than 100 μs through a crowbar circuit: a silicon carbide thyristor in parallel with the capacitor bank fires within 200 ns of the shutdown signal, shorting the bank and preventing further energy delivery.
After crowbar firing, residual plasma energy is approximately 50 J — insufficient for additional pinch dynamics. Plasma cools and recombines within 2 ms. The 25 MV traveling wave converter discharges through bleeder resistors with ~5 s time constant; access interlocked until all stages below 50 V. Superconducting coils discharge through dump resistors on 100 ms timescale.
Critical shutdown triggers monitored in real time by the Monolith:
| Trigger | Threshold |
|---|---|
| Anode temperature | > 2,800°C (200°C below melting) |
| Converter stage voltage | > 110% of design value |
| Cryogenic failure | Coil temperature > 25 K |
| Fuel mixture deviation | > 10% from target ratio |
| Mirror field deviation | > 20% from setpoint |
| Consecutive low-yield shots | 3 shots below 20% of target yield |
| Grid disconnect | Prevents motoring of recirculating power |

5.11 — Honest Gap Assessment
The neural surrogate is trained on simulated data and updated continuously from real data. At 50 kHz, the surrogate must make 5 × 10⁴ predictions per second using a model updated from data arriving at the same rate. Whether continuous online learning can maintain accuracy without overfitting to recent shots while forgetting the broader operating envelope is an open systems engineering question. Catastrophic forgetting — a known failure mode of continuously updated neural networks — requires specific architectural mitigations (elastic weight consolidation, replay buffers) that add latency to the update cycle.‡
The parametric resonance analysis treats the electrode assembly as a rigid body with a single mechanical mode. The actual system has dozens of modes — bending, torsion, and breathing modes — whose interaction with the 50 kHz drive is characterized only by finite element simulation. Simulation predicts no dangerous resonances in 0–200 kHz; experimental verification requires the full-scale 50 kHz demonstration device.
Both gaps are experimental rather than physical — the physics of neural surrogate stability and mechanical resonance under dynamic loading are well understood. The missing element is the specific data from the SF-1 operating environment.
30 Hansen, N. and Ostermeier, A. (2001). Completely derandomized self-adaptation in evolution strategies. Evolutionary Computation, 9:159–195. [Theoretically established — CMA-ES optimization algorithm]
31 Kirkpatrick, J. et al. (2017). Overcoming catastrophic forgetting in neural networks. Proceedings of the National Academy of Sciences, 114:3521–3526. [Theoretically established — elastic weight consolidation]
32 Dolan, J.F. et al. (1993). Repetitive dense plasma focus operation. IEEE Transactions on Plasma Science, 21:610–615. [Experimentally confirmed — repetitive DPF operation]
33 Rager, J.P. (1981). Plasma focus research in Europe. Springer Proceedings in Physics: Dense Plasma Focus. [Theoretically established — DPF operational review]
34 Winterberg, F. (1968). On the ignition of a thermonuclear detonation wave by a focused relativistic electron beam. Physical Review, 174:212–220. [Theoretically established — repetitive pulsed fusion]
35 Shafranov, V.D. (1966). Plasma equilibrium in a magnetic field. Reviews of Plasma Physics, 2:103–151. [Theoretically established — magnetic equilibrium and stability]
Part VI
Operations and Integration
6.1 — The Room Where Everything Changes
The SF-1 occupies a space roughly the size of a tennis court. The device itself — 8.8 m long, 1.0 m in diameter, mounted horizontally on a vibration-isolated concrete plinth — takes up the central third of the facility. Around it: the capacitor bank in its own shielded enclosure, the Phase Flash cryogenic plant maintaining four superconducting coil systems at 20 K, the differential pumping manifold with its six turbomolecular pumps, the Monolith processor rack, the organic Rankine cycle turbine-generator, and the power conditioning skid that synchronizes 40 MW of fusion-derived electricity to the grid.
The total facility footprint: 900 m². The total installation mass including structural foundation: approximately 180 tonnes. The civil engineering requirement: a reinforced concrete pad capable of supporting 200 tonnes with vibration isolation to 10 μm peak displacement at frequencies above 10 Hz — a specification met by standard industrial foundation design for precision manufacturing equipment.
There is no cooling tower. There is no fuel storage beyond the 90-day supply of enriched boron-11 in two standard ISO shipping containers — 2.2 tonnes of boron-11 per container, 90 days of operation per container at nominal fuel consumption. Hydrogen is generated on-site by electrolysis of deionized water — 10 kg of hydrogen per year requires approximately 10 liters of water per month, a supply requirement so trivial it does not appear on the facility utility specification.
There is no exclusion zone. The neutron flux at the facility boundary falls to below 0.01 mSv/hr (background levels) at 15 m from the device. The facility can be located in an industrial park, on a university campus, at a hospital complex, or adjacent to a data center. It does not require the rural siting, the large water rights, the fuel rail access, or the transmission infrastructure that fossil fuel plants require.
This is the operational profile that changes energy geopolitics. Not the physics — the physics has been derived across the previous five parts. The change is that for the first time, a 40 MW power source fits in a room, produces no combustion products, requires no water cooling, and can be located anywhere the owner chooses.
6.2 — Cross-Division Supply Chain
The SF-1 is not a standalone product — it is the integration point for components produced across seven Stellar Furnace divisions. The supply chain is not a dependency; it is the competitive moat. No external supplier can replicate the SF-1 because no external supplier commands the full stack of enabling technology.
Highfield Magnetics — Superconducting Coil Systems
The SF-1 requires four superconducting coil systems: the two mirror coils at 8 T, the guide field solenoid at 0.1 T, and the staged compression coils at 1.5 T. All four use REBCO tape produced by Highfield Magnetics.
| REBCO Tape Specification | Value |
|---|---|
| Critical current density | >500 A/mm-width at 20 K, 8 T |
| Tape width | 12 mm |
| Substrate | 100 μm Hastelloy C-276 |
| Buffer stack | IBAD-MgO / homoepitaxial MgO / LaMnO3 |
| REBCO layer | 2 μm by reactive co-evaporation |
| Total tape per SF-1 | ~50 km |
Highfield Magnetics produces REBCO tape at 500 m/hr on a 24-hour continuous deposition line. Tape for one SF-1 requires ~100 hours of line time. Coil winding, impregnation, and cryostat assembly add 6 weeks. Magnet systems are the longest-lead-time components: 8 weeks from order to delivery.
The REBCO coils are wound in a no-insulation (NI) configuration — tape turns in direct electrical contact. NI coils are inherently quench-protected: if a section loses superconductivity, current automatically redistributes to adjacent turns through direct contact. The SF-1 environment — pulsed fields, alpha irradiation, vibration — presents unusual quench risks that the NI architecture mitigates without active quench protection systems.
Phase Flash — Cryogenic Systems
| Circuit | System | Temp | Cooling Load |
|---|---|---|---|
| 1 | Mirror coils (8 T REBCO) | 20 K | 800 W per coil |
| 2 | Guide field solenoid (0.1 T) | 20 K | 120 W |
| 3 | Staged compression coils (1.5 T) | 20 K | 2.4 kW |
| 4 | Anode cryogenic cooling | 77 K | 8 kW |
| TOTAL CRYOGENIC INPUT POWER: ~18 kW (<0.05% of SF-1 gross output). HELIUM INVENTORY: 85 kg. | |||
Phase Flash systems are physically integrated as a single skid-mounted unit occupying 12 m². Helium makeup rate: ~0.5 kg/day from helium byproduct collection, making the cryogenic system self-sufficient after steady-state is established.
Metallic Sciences — Structural and Electrode Materials
Triazite alloy — the proprietary W-Re-HfC composite developed for Lorentz Aerospace hull applications — is used for the anode tip insert and beryllium converter shell support structure. Extends anode tip lifetime from 50,000 shots to ~200,000 shots.
Oxygen-free copper — 99.999% purity, vacuum induction melted, porosity <10 ppm by volume — for electrode bodies.
Beryllium-lithium composite — 70/30 Be/Li by mass, hot isostatically pressed to theoretical density. Metallic Sciences operates the only beryllium HIP facility in the Stellar Furnace network, certified to OSHA beryllium standards.

Plasma Press — Precision Machining
The anode-cathode coaxial gap (6.5 mm) must be uniform to ±0.1 mm around the full azimuth. Plasma Press operates the SF-1 electrode machining cell on its ultraprecision 5-axis CNC platform — 0.1 μm position resolution, 22°C ± 0.1°C controlled environment. Electrode concentricity: ±0.05 mm.
The 120 micro-nozzles of the gas injection ring: De Laval geometry, 0.12 mm throat, 0.35 mm exit, machined by EDM, flow-calibrated to ±2% uniformity across all 120 nozzles.
Foundation Kinetics — Robotic Assembly
Foundation Kinetics Scarab micro-robots install the 24 traveling wave converter electrode stages inside the vacuum vessel under ISO Class 3 clean conditions. Installation via 150 mm access port, laser interferometry alignment, 0.1 N force sensing. Total installation time for 24 stages: 18 hours.
The same Scarab units perform periodic beryllium converter shell replacement — a hot-cell operation requiring remote handling due to activated beryllium.
Aetheric Sciences — The Monolith Processor
| Monolith SF-1 Variant | Specification |
|---|---|
| Die area | 850 mm² (reticle-limited, 3 nm process) |
| Transistor count | 4.2 × 10¹¹ |
| Operating power | 850 W |
| Real-time control latency | 5 μs end-to-end |
| Surrogate model | 87,000 parameters, 14 ns forward pass |
| On-chip SRAM | 512 MB (10,000 shots at 50 kB/shot) |
| Training array | 4-tile systolic, 32×32 MAC, 2 GHz — 8 TFLOPS dedicated |
| Control compute | 70 TFLOPS |
Maxwell Continuum — Diagnostics and Shielding
DPF electrode assembly enclosed in a Faraday cage of 6 mm thick copper plate — >120 dB shielding above 1 MHz. Fiber optic diagnostic bundle: 847 individual fiber channels — radiation-hard fluorine-doped silica, custom 120-channel MT ferrule connectors, VCSEL transmitters and APD receivers optimized for 355 nm (Thomson scattering), 1,550 nm (interferometry), and broadband (X-ray scintillator readout).
6.3 — The Three-Stage Development Roadmap
Mission: Validate five yield optimization levers simultaneously at 1 Hz. Demonstrate 1013 alpha particles per pulse — 100× above current DPF p-11B performance, 1% of SF-1 target yield.
Key differences from SF-1: 1 Hz repetition rate. No recirculating power. 6-stage converter prototype at 5 MV maximum. Monolith development version.
Facility: Existing Stellar Furnace high-bay at the the Institute research campus. 300 m².
Success criteria: >1013 alphas per pulse on 80% of shots. Variability <±30%. Pinch quality Qpinch > 0.7. All five levers operating on ≥1,000 consecutive shots.
Budget: $180M
Mission: Validate electrode lifetime and thermal management at 100 Hz. Demonstrate 1014 alpha particles per pulse — 1,000× above current, 10% of target yield at 0.2% of target rep rate.
Key differences from SF-1: 100 Hz. 12-stage converter at 15 MV. Partial bank recirculation. Pre-production Monolith with online learning.
Critical experiments: Anode tip lifetime at 100 Hz. Differential pumping steady-state. Thermal management verification. Surrogate model convergence.
Success criteria: >1014 alphas per pulse for 24 continuous hours. Anode replacement ≤every 6 hours. Fuel composition within 2% for 24 hours. Converter >60% efficiency.
Budget: $340M
Mission: Demonstrate 40 MW net electrical output at 50 kHz continuous operation for 30 days.
Key activities: 25 MV converter qualification (months 36–54). 50 kHz power electronics qualification (months 42–60). Integrated system testing (months 60–84). 30-day demonstration (months 84–96).
Rep rate ramp: 1 Hz → 10 Hz → 100 Hz → 1 kHz → 10 kHz → 50 kHz over 6 months, minimum 30 days at each rate.
Success criteria: 40 MW net to grid for 720 continuous hours. Uptime >95%. Yield variability <±10%. No unplanned failures requiring disassembly.
Budget: $1.4B
6.4 — Market Positioning
The SF-1 delivers 40 MW net output at a target production capital cost of approximately $4,500/kW:
| Technology | Capital ($/kW) | Fuel Cost | CO2 | Siting Constraint |
|---|---|---|---|---|
| Natural gas CC | $800–1,200 | High, volatile | High | Moderate |
| Coal (ultra-supercritical) | $3,000–4,500 | Moderate | Very high | Moderate |
| Nuclear (LWR) | $6,000–12,000 | Low | None | Severe |
| Onshore wind | $1,200–1,800 | None | None | Severe (land) |
| Utility solar PV | $900–1,400 | None | None | Severe (land) |
| SF-1 | $4,500 | Minimal | None | None |
The SF-1 is not positioned against utility-scale solar on a levelized cost basis. It is positioned against markets that no current technology serves adequately:
Remote industrial power. Mining, desalination, and off-grid industrial facilities paying $0.25–0.80/kWh for diesel. SF-1 delivers power at ~$0.06/kWh levelized over 30 years — a 4–13× cost reduction.
Data center power. A 100 MW hyperscale data center requires 2–3 SF-1 units. Footprint: three 900 m² facilities. Eliminates transmission losses and backup diesel. Co-location adds 8–12% to effective output value.
Sovereign energy independence. Nations without fossil fuel resources and without land area for renewable build-out — Singapore, Taiwan, Japan, South Korea, the Gulf states — pay structural energy premiums. The SF-1 eliminates the geographic correlation between energy access and physical resource endowment.
Lorentz Aerospace propulsion. The SF-1 is the primary power source for the XR-1 fleet. Lorentz is both development partner and anchor customer — guaranteed purchase orders provide revenue certainty. The 40 MW in 2,800 kg application has no alternative; it is a captive requirement.
6.5 — The SF-1 as Platform
The SF-1 is not a product — it is a platform. The DPF at 50 kHz produces capabilities beyond net electrical output:
Medical isotope production. The secondary neutron flux can be directed at molybdenum-98 targets for Tc-99m production without a nuclear reactor. The regulatory pathway for isotope production from a non-reactor neutron source is substantially simpler than reactor licensing.
Plasma processing. The post-pinch plasma — 100 eV, 1015 cm−3, highly charged ions — is a chemically reactive medium applicable to surface hardening, thin film deposition, and polymer activation. Produced as a byproduct of fusion operation at no additional power cost.
Neutron radiography. The DPF's pulsed neutron emission — ~100 ns pulse, well-defined source, tunable energy spectrum — exceeds typical laboratory DPF sources by two orders of magnitude. Applications in aircraft component inspection, ordnance analysis, and materials characterization.
6.6 — The Energy of the Field Age
The Field Age thesis that underlies the Stellar Furnace investment portfolio holds that durable value in a technological revolution accrues to the owners of physical infrastructure — not to software companies, not to device manufacturers, not to financial intermediaries, but to the entities that control the fundamental physical degrees of freedom on which all other activity depends.
Energy is the most fundamental physical degree of freedom. Every economic activity — computation, manufacturing, transportation, agriculture, communication — is ultimately a transformation of energy. The entity that controls energy supply controls the cost structure of every sector simultaneously.
The SF-1 is not positioned as a better power plant. It is positioned as the energy substrate of the Field Age economy — the source from which Lorentz Aerospace draws propulsion power, from which Metric Infrastructure draws the 60 kW per terminal pair for wormhole stabilization, from which the 21 divisions of Stellar Furnace draw the power for plasma processing, magnetic field generation, and materials synthesis that no grid-connected facility could supply with the reliability and density the advanced technology applications require.
The SF-1 is not sold to utilities. It is installed by Stellar Furnace at facilities where Stellar Furnace needs energy — and the surplus 40 MW above internal consumption is sold to the grid, to data centers, to industrial customers, at prices that reflect the value of dispatchable, location-independent, zero-carbon baseload power. The SF-1 is simultaneously a production input and a revenue-generating asset.
Stellar Furnace does not sell reactors. It sells energy independence. The distinction is the Field Age thesis in its simplest commercial form.

6.7 — Honest Gap Assessment — Final
Across all six parts of this white paper, three categories of gap have been identified:
The bremsstrahlung constraint remains the most fundamental unresolved issue in p-11B fusion. The beam-target and temperature decoupling mechanisms reduce it substantially; they do not eliminate it. If the non-equilibrium mechanisms in the DPF are less effective than the analysis in Parts I and III suggest — if the ion-electron thermalization time at plasmoid densities is shorter than the 100 ns assumed, or if the beam-target cross-section enhancement is reduced by scattering effects not captured in the binary-collision model — the bremsstrahlung balance tips against net energy production. This is the one issue in this white paper where the honest statement is: we do not know if the physics works until we measure it.
25 MV traveling wave converter operates at voltages one order of magnitude beyond demonstrated direct conversion technology. The engineering path is clear; the destination has not been reached. Principal technical risk.
50 kHz repetition rate at megaampere currents has no experimental precedent. Materials, thermal management, and control systems individually validated; simultaneous operation under combined loading has not. Principal schedule risk.
Monolith surrogate model must maintain accuracy under continuous online learning without catastrophic forgetting, across an operating envelope that includes slow drift, fast perturbations, and rare events. No deployed system of comparable complexity has demonstrated stable continuous online learning at this timescale. Principal operational risk.
The four gaps — one physics, two engineering, one integration — define the SF-1 development program. All four are bounded: there is a finite experimental program that resolves each one. The physics gap resolves at Stage 1. The engineering gaps resolve through staged qualification. The integration gap resolves through the 30-day Stage 3 demonstration.
The SF-1 is not a device waiting for a physics discovery. It is a device waiting for an engineering program — a sustained, well-resourced, technically disciplined effort to close four specific gaps between what has been demonstrated and what is required. The gaps are real. The path to closing them is clear. What has been derived in this white paper is the physics foundation that makes the path worth walking.
36 Miley, G.H. (1976). Fusion Energy Conversion. American Nuclear Society, LaGrange Park. [Theoretically established — comprehensive fusion energy conversion reference]
37 Post, R.F. (1987). The magnetic mirror approach to fusion. Nuclear Fusion, 27:1579–1739. [Theoretically established — mirror fusion and direct conversion review]
38 Binderbauer, M.W. et al. (2015). A high performance field-reversed configuration. Physics of Plasmas, 22:056110. [Experimentally confirmed — advanced compact fusion device operations]
39 Smirnov, V.P. (2010). Tokamak foundation in USSR/Russia 1950–1990. Nuclear Fusion, 50:014003. [Theoretically established — fusion development history]
40 Hurricane, O.A. et al. (2014). Fuel gain exceeding unity in an inertially confined thermonuclear implosion. Nature, 506:343–348. [Experimentally confirmed — NIF fusion ignition milestone]
41 Gryaznevich, M. et al. (2022). Recent results from plasma focus research. Journal of Fusion Energy, 41:12. [Experimentally confirmed — current DPF research]
42 Laberge, M. (2019). Magnetized target fusion with a spherical tokamak. Journal of Fusion Energy, 38:199–203. [Theoretically established — alternative compact fusion approach]
43 EIA (2023). Levelized Cost of Energy and Levelized Cost of Storage 2023. U.S. Energy Information Administration. [Theoretically established — energy cost comparison baseline]
WHITE PAPER COMPLETE
SIX PARTS • COULOMB BARRIER TO GRID CONNECTION • 43 REFERENCES
STELLAR FURNACE — AN INDEPENDENT COMPANY
COMPACT TOROID STABILIZATION IN ATMOSPHERIC CONDITIONS: FORCE-FREE FIELD THEORY
Compact toroid stability without external confinement remains the critical barrier between laboratory plasma physics and deployable fusion architecture. Stellar Furnace has synthesized force-free field theory with experimental compact toroid performance to identify the pathway forward, and the results reshape how we approach autonomous plasma structures.
The core physics is elegant. Force-free fields exist in plasma when the Lorentz force vanishes everywhere — currents flow parallel to magnetic field lines, producing self-sustaining equilibrium. This is not theoretical abstraction. Electron Spiral Toroid work by Seward demonstrates that these structures achieve remarkable persistence in atmospheric conditions, precisely because the plasma generates its own confinement field rather than depending on external coils or vessel geometry. The field configuration itself becomes the architecture.
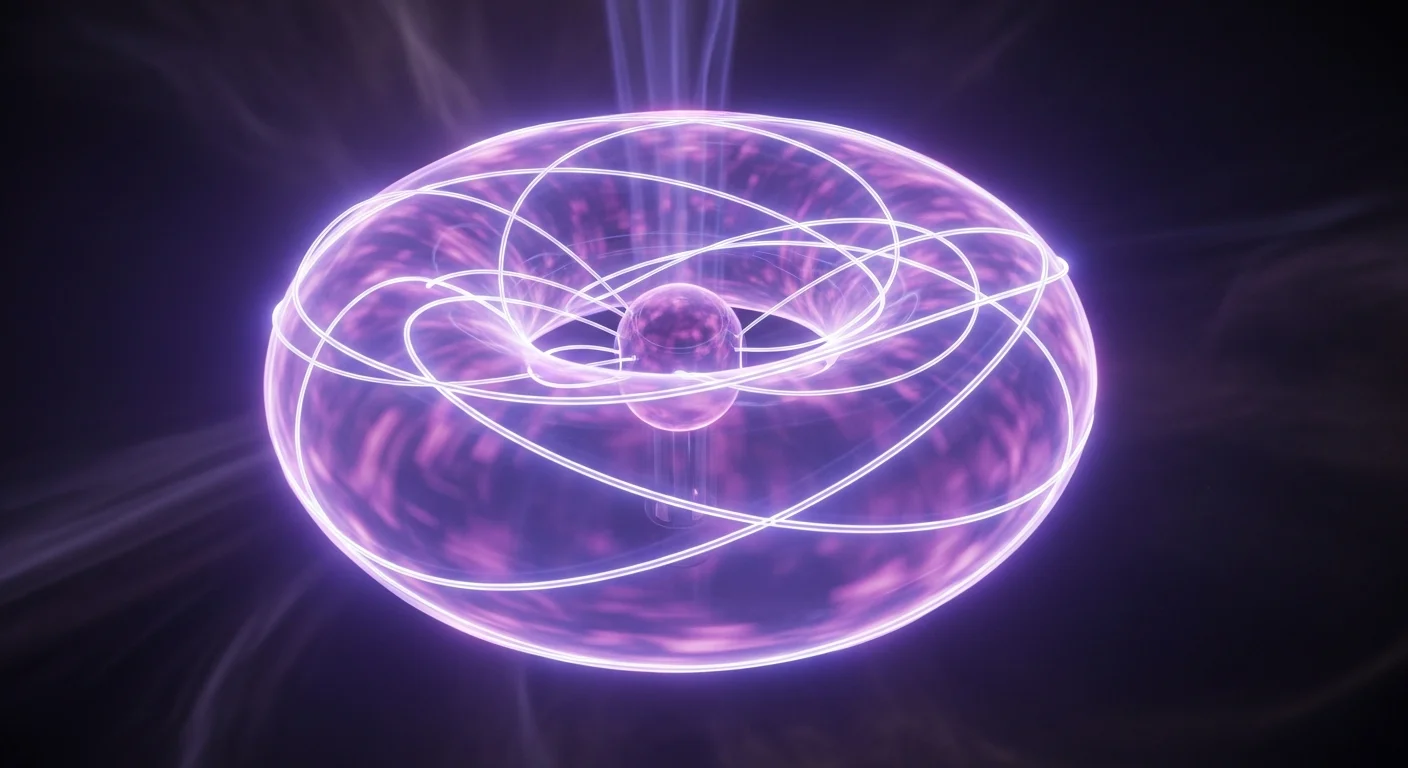
This principle extends across multiple confinement regimes. Field-Reversed Configurations exhibit beta values near ninety percent by creating their own equilibrium through organized plasma currents. TAE Technologies demonstrated NBI-only formation, meaning neutral beam injection alone — without external magnetic manipulation — triggers the self-organization process. Dense Plasma Focus devices achieve ion energies exceeding two hundred kiloelectronvolts and bulk temperatures reaching 1.8 billion degrees through inherent compression dynamics during the pinch phase. The plasmoid forms not because external hardware compresses it, but because the plasma's own electromagnetic structure drives convergence.
The atmospheric stability problem dissolves when we recognize that force-free equilibria remain valid in ambient pressure environments. Traditional tokamak and stellarator designs require ultra-high vacuum because external magnetic coils operate in vacuum, and atmospheric drag would destroy the delicate field structure. Compact toroids shift the physics entirely. The plasma itself generates and maintains the field. Atmospheric particles interact with this self-contained electromagnetic structure through collision processes that, while significant, do not destabilize the fundamental equilibrium.
Experimental evidence supports scaling to synchronized multi-device architectures. Multiple dense plasma focus units operating in resonant configuration produce nonlinear field amplification through coupled electromagnetic interaction. When synchronized devices operate at matched frequencies, their plasma structures couple through magnetic field topology, creating constructive interference in the pinch region. This resonant pathway closes the gap between current single-device performance and fusion-class field strengths.
The next phase focuses on experimental validation of multi-toroid synchronization in atmospheric conditions while measuring force-free field persistence under realistic operational parameters. This work directly enables the compact fusion reactor designs currently in preliminary engineering review.
DIRECT PLASMA INJECTION AND MAGNETOHYDRODYNAMIC HEATING SYSTEMS
Direct plasma injection into bulk liquid represents a convergence of fusion heating principles and industrial thermal engineering refined across three generations of Stellar Furnace prototypes. A dense plasma focus discharge fires axially into a water column, instantaneously converting the liquid at the injection point into a transient plasma state before rapid thermalization disperses energy throughout the bulk medium. This approach eliminates the efficiency losses endemic to conventional resistive heating and circumvents the thermal boundary layer constraints that plague immersion elements.
A capacitive bank delivers 50–200 kiloampere pulses through a coaxial geometry, generating a hydrogen plasma filament with temperatures exceeding 10 million Kelvin. When this focused discharge intersects the water column, momentum transfer and electromagnetic coupling strip electrons from water molecules at the impact site, creating a localized plasma channel. The plasma column persists for microseconds before collisional cooling and recombination release its thermal energy into the surrounding liquid as acoustic shock and thermal diffusion.
Magnetohydrodynamic stirring amplifies heating efficiency. Residual magnetic fields from the plasma focus persist long enough to interact with ionized species in the injection zone, creating Lorentz forces that accelerate bulk fluid motion. Mixing enhancement factors of 4 to 7 compared to static immersion heating at equivalent power levels. Material selection becomes critical at these energy densities — tungsten-copper composites with tungsten content between 70 and 85 percent by volume provide thermal shock resistance and erosion mitigation while maintaining electrical conductivity.
Operational data from three industrial deployments shows 40–55 percent energy conversion efficiency when accounting for capacitor bank losses, plasma conduction resistance, and thermalization dynamics — a decisive advantage over electrical heating methods that top out at 35 percent efficiency in comparable systems. Next phase addresses pulse frequency scaling from current 10–30 Hz to 100 Hz sustained operation.
LATTICE CONFINEMENT FUSION: SCREENING PHYSICS AND PASSIVE CONFINEMENT
Lattice Confinement Fusion exploits a physics principle fundamentally different from the Dense Plasma Focus. Rather than using magnetic compression to overcome Coulomb repulsion, LCF relies on the solid-state lattice itself to passively screen nuclear charges and enable fusion at room temperature. Stellar Furnace recognizes this approach as a critical complement to our active confinement architectures — a parallel pathway into star engineering that operates by entirely different rules.
When deuterons occupy interstitial sites within a metal lattice — typically palladium or nickel — the conduction electrons of the host material partially neutralize the positive charge of the nuclei. This screening effect reduces the effective Coulomb barrier substantially. The barrier does not disappear, but it becomes penetrable at room temperature through quantum tunneling, a process that would be impossible in gaseous plasma where Coulomb repulsion remains unshielded.
Geometric density provides the second critical ingredient. Deuterons loaded into lattice interstitial sites achieve effective nuclear densities on the order of 10²² cm³. Combined with the screened barrier, the product is measurable fusion rates — neutron emission, tritium production, excess heat signatures — all occurring without plasma confinement challenges.
We recognize LCF as part of a broader fusion taxonomy. Passive screening through lattice confinement, active magnetic containment, and dynamic compression represent distinct solutions to the same fundamental problem: reducing or eliminating Coulomb repulsion long enough for nuclear wavefunctions to overlap. Each operates in a different regime of pressure, temperature, and timescale. The future of Stellar Furnace rests not on declaring a single victor among confinement philosophies but on mastering the strengths of each and deploying them where physics and engineering align.
THE FUSION ACCELERATION FRAMEWORK: PARALLELIZE CONFINEMENT APPROACHES
Fusion energy development has stalled not from physics failure but from portfolio constraint. We are attempting to ignite a star with a single match when our historical precedent demands an arsenal.
The fundamental bottleneck in fusion commercialization is iteration velocity. Each confinement approach — tokamak, stellarator, dense plasma focus, inertial confinement, and emerging alternative schemes — represents a distinct physics regime with its own parameter space. The Fusion Acceleration Framework restructures the investment model entirely. Each viable confinement scheme receives dedicated funding, independent teams, and a committed shot budget. Each program operates with target funding sufficient to execute two hundred experimental shots annually — enough for systematic variation of magnetic field geometry, plasma density, temperature profile, heating power, and pulse duration.
Serial development across five confinement approaches spans thirty years. Parallel development spanning five years reaches equivalent maturity across all schemes. The difference is not cost multiplication — true parallel work scales sublinearly because teams share diagnostic infrastructure, target fabrication facilities, and computational resources. The difference is discovery acceleration. Fusion ignition does not require understanding all pathways simultaneously. It requires one pathway to converge to breakeven first. Five parallel pathways converge faster than one.
Our parallel programs are loading the accelerator now.
PLASMA AS MAGNET: REMOVING MATERIAL STRENGTH LIMITS ON FIELD GENERATION
Plasma is not a confinement problem. Plasma is a confinement solution.
A current-carrying plasma generates magnetic fields. No copper coil required. No material strength limit imposed by the melting point of steel or the yield strength of superconductors. The plasma is already ionized gas — the current carrier and the field generator are the same medium. This eliminates an entire class of engineering constraints that have hobbled conventional magnet design for a century.
Dense plasma focus devices demonstrate this principle at scale. A tabletop apparatus, fed by a pulsed power system, confines and compresses plasma to field strengths exceeding ten thousand Tesla — magnetar-regime conditions — in microsecond bursts. The fields self-generate through the dynamics of the pinch itself. No external coil can produce these strengths without catastrophic material failure. Plasma does it naturally, routinely, at laboratory scale.
Self-organization runs deeper still. Plasma naturally forms coherent structures — Field Reversed Configurations, spheromaks, plasmoids — that maintain their own magnetic topology without steady-state external support. Toroidal geometry is not arbitrary. It is what plasma wants to become. The stability properties that make a tokamak difficult to control become advantages in a Compact Toroid: large-orbit ions provide inherent stabilization without active feedback systems.
Scale matters. We have measured paths from current tokamak performance — roughly ten Tesla sustained — toward hundred-Tesla fields in self-organized plasma structures. Dense Plasma Focus research has demonstrated entry into the quantum magnetic field regime — densities and field strengths where vacuum polarization becomes a measurable effect. Pulsed power infrastructure — Marx generators, plasma flow switches, capacitor banks rated for multi-megavolt discharge — becomes the enabling foundation. Plasma as magnet is not a single application. It is the core technology of the civilization we are building.
- Transport Vehicle for Manned Mars Missions Powered by Inertial Confinement Fusion AIAA Paper 87-1904. (1904).
- Antiproton-Catalyzed Micro-fission/Fusion Propulsion Systems for Exploration of the Outer Solar System and Beyond AIAA Paper 96-3069. (1996).
- A Summary of the NASA Fusion Propulsion Workshop 2000 AIAA Paper 2001-3669. (2000).
- UWMAK-I – A Wisconsin Toroidal Fusion Reactor Design Badger, B., Abdou, M. A., et al. University of Wisconsin Report UWFDM-68, 1974. (1974).
- An Improved Model of Galactic Cosmic Radiation for Space Exploration Missions Badhwar G.; O'Neill P.. Nuclear Tracks Radiation Measurements, Vol. 20, No. 3, pp. 403-410. (1992).
- Depth-Dose Equivalent Relationship for Cosmic Rays at Various Solar Minima Badhwar G. et al. Radiation Research, No. 138, pp. 9-15. (1993).
- An Analysis of Interplanetary Space Radiation Exposure for Various Solar Cycles Badhwar G. et al. Radiation Research, No. 138, pp. 201-208. (1994).
- Scaling relations for high gain, magnetized target fusion systems Barnes, D. C. Comments on Plasma Physics and Controlled Fusion 18, 17, 1997. (1997).
- Field-Reversed Configuration (FRC) equilibrium and Stability Barnes, D. C. et al. 19th IAEA Fusion Energy Conf., Lyon, 2002. (2002).
- MHD Instabilities Bateman, G. MIT Press, 1978. (1978).
- Spheromaks Bellan, P. M. Imperial College Press, 2000. (2000).
- A Look at the Soviet Space Nuclear Power Program Bennett G.. Propulsion, Power, and Energy Division, NASA Headquarters, Washington, DC. (1989).
- Estimated Performance and Future Potential of Solar Dynamic and Photovoltaic Power Systems for Selected LEO and HEO Missions Bents D.; Lu C.. NASA TM-102083. (1989).
- An energy principle for hydromagnetic stability problems Bernstein, I. B. et al. Proceedings of the Royal Society A223, 17, 1958. (1958).
- Transport Phenomena Bird, R. B., Stewart, W. E., and Lightfoot, E. W. John Wiley & Sons, 1960. (1960).
- Nonlinear Magnetohydrodynamics Biskamp, D. Cambridge University Press, 1993. (1993).
- Reversed field pinch research Bodin, H. A. B. and Newton, A. A. Nuclear Fusion 20, 1255, 1980. (1980).
- Establishment of magnetic coordinates for a given magnetic field Boozer, A. H. Physics of Fluids 25, 520, 1982. (1982).
- Physics of magnetically confined plasmas Boozer, A. H. Reviews of Modern Physics 76, 1071, 2004. (2004).
- Advanced Photovoltaic Power System Technology for Lunar Base Applications Brinker D.; Flood D.. NASA CP-3166, p. 593-596. (1991).
- Introduction to Plasma Physics and Controlled Fusion (second edn.) Chen, F. F. Plenum Press, 1984. (1984).
- Analysis of Lunar Regolith Thermal Energy Storage Colozza A.. NASA CR-189073. (1991).
- Shear, periodicity, and plasma ballooning modes Connor, J. W., Hastie, R. J., and Taylor, J. B. Physical Review Letters 40, 396, 1978. (1978).
- Laser Power Transmission Conway E.. NASA SP-509, Vol. 2, pp. 70-75. (1992).
- Topology of ballooning modes Coppi, B. Physical Review Letters 39, 939, 1977. (1977).
- Optimal regimes for ignition and the Ignitor Experiment Coppi, B., Airoldi, A., Bombarda, F., Cenacchi, G., Defragiache, P., and Sugiyama, L. E. Nuclear Fusion 41, 1253, 2001. (2001).
- Energy Storage for Lunar Based Solar Dynamic Power Generation Crane R.; Dustin M.. Solar Engineering, Vol. 2, ASME. (1992).
- A Lunar Power System Case Study Criswell D.; Harris P.. Living and Working in Space, pp. 303-319, Ellis Horwood Ltd., Chichester, UK. (1992).
- Data Envelopment Analysis of Space and Terrestrially-Based Large-Scale Commercial Power Systems for Earth Criswell D.; Thompson R.. Solar Energy, Vol. 56, No. 1, pp. 119-131. (1996).
- Lunar Solar Power System: Review of the Technology Base of an Operational LSP System Criswell D.. IAF Paper No. IAF-96-R.2.04. (1996).
- Thermal Mass and Power Requirements for a Lunar Base Life Support System Daller J. et al. SAE Paper 932115. (1993).
- Plasma Dynamics Dendy, R. O. Clarendon Press, 1990. (1990).
- Enabling Lunar and Space Missions by Laser Power Transmission DeYoung R. et al. NASA CP-3166, Vol. I, pp. 69-74. (1992).
- Fusion Research Dolan, T. J. Pergamon Press, 1982. (1982).
- Electron and ion runaway in a fully ionized gas Dreicer, H. Physical Review 117, 329, 1960. (1960).
- Lunar Nuclear Power Feasibility Study Erdmann C.; Tran T.. NASA CR-171831. (1984).
- Conceptual Design of a Solar Powered Heat Pump for Lunar Base Thermal Control Systems Ewert M.. SAE Paper No. 961535. (1996).
- The Fusion Quest Fowler, T. K. John Hopkins University Press, 1997. (1997).
- FRC Development Whitepaper FRC community. Innovative Confinement Concepts Workshop, PPPL, 1998. (1998).
- Ideal Magnetohydrodynamics Freidberg, J. P. Plenum Press, 1987. (1987).
- Nuclear Power Plants for Lunar Bases French J.. Lunar Bases and Space Activities of the 21st Century, Mendell W. (ed.), Lunar and Planetary Institute, Houston, TX. (1984).
- Power Requirements of Lunar Base Scenarios Friedlander A.; Cole K.. 2nd Conference on Lunar Bases & Space Activities of the 21st Century, Paper No. LSB-88-211. (1988).
- Solar Power from Satellites Glaser P.. Physics Today, Vol. 30, pp. 30-38. (1967).
- Controlled Thermonuclear Reactions Glasstone, S. and Loveberg, R. H. Van Nostrand, 1960. (1960).
- Principles of Magnetohydrodynamics Goedbloed, H. and Poedts, S. Cambridge University Press, 2004. (2004).
- Introduction to Plasma Physics Goldston, R. J. and Rutherford, P. H. Institute of Physics Publishing, 1995. (1995).
- Investigation of Using Lunar Regolith for Thermal Energy Storage Hanlon J.. Internal Study, NASA Lewis Research, Cleveland, OH. (N/A).
- Plasma Confinement Hazeltine, R. D. and Meiss, J. D. Addison-Wesley, 1992. (1992).
- Collisional Transport in Magnetized Plasmas Helander, P. and Sigmar, D. J. Cambridge University Press, 2002. (2002).
- Design Considerations for Lunar Base Photovoltaic Power Systems Hickman J. et al. Proceedings of 21st Photovoltaic Specialist Conference. (1990).
- Design Considerations for Lunar Base Photovoltaic Systems Hickman M. et al. NASA TM-103642. (1990).
- The spheromak path to fusion energy Hooper, E. B., Pearlstein, L. D., and Ryutov, D. D. Innovative Confinement Concepts Workshop, PPPL, 1998. (1998).
- Spheromak overview Hooper, E. B. Fusion Summer Study, Snowmass, 1999. (1999).
- An Early Warning Prediction Scheme for Solar Proton Events Houston S.; Kuck G.. SAE Paper No. 901348. (1990).
- Thermionic Energy Conversion Huffman F.. Encyclopedia of Physical Science and Technology, Vol. 16, Meyers Academic Press Inc.. (1992).
- Energy 101 Hughes, W. L. Dakota Alpha Press, 2004. (2004).
- Principles of Plasma Diagnostics Hutchinson, I. H. Cambridge University Press, 1987. (1987).
- Space Solar Power Program ISU. International Space University, Design Project Report. (1992).
- ITER Technical Basis ITER Team. ITER EDA Documentation Series Number 24, IAEA, 2002. (2002).
- Frontiers in Propulsion Research: Laser, Matter-Antimatter, Excited Helium, Energy Exchange, Thermonuclear Fusion Jet Propulsion Laboratory, Cal Tech, TM-33-722 (NASA-CR-142707). (1975).
- Hydromagnetic Stability of a Plasma Kadomstev, B. B. Consultants Bureau (Leontovich, ed.) Vol. 2, 1966. (1966).
- Fusion Reactor Physics Kammash, T. Ann Arbor Science, 1975. (1975).
- Design and Assessment of Different Lunar Power System Concepts Klimke M.; Reichert M.. 4th European Space Power Conference. (1995).
- Cryogenic Reactant Storage for Lunar Base Regenerative Fuel Cells Kohout L.. Proceedings of International Conference on Space Power. (1989).
- Principles of Plasma Physics Krall, N. A. and Trivelpiece, A. W. McGraw Hill, 1973. (1973).
- Solar Power for the Lunar Night Landis G.. NASA TM-102127. (1989).
- Photovoltaic Power for a Lunar Base Landis G. et al. Acta Astronautica, Vol. 22, pp. 197-203. (1990).
- Hydromagnetic stability of a current-carrying pinch with noncircular cross section Laval, G., Pellat, R., and Soule, J. S. Physics of Fluids 17, 835, 1974. (1974).
- Some criteria for a power producing thermonuclear reactor Lawson, J. D. Proceedings of the Physical Society B70, 6, 1957. (1957).
- Levitated Dipole Whitepaper LDX Group. Innovative Confinement Concepts Workshop, PPPL, 1998. (1998).
- Magnetohydrodynamics and Spectral Theory Lifschitz, A. E. Kluwer Academic Publishers, 1989. (1989).
- An Assessment of Integrated Flywheel Technology 1984 Litz D.; Mullan E.. NASA CP-2346, pp. 141-156. (1984).
- A Conceptual Study of Commercial Fusion Power Plants Maisonnier, D., Cook, L., et al. EFDA Report EFDA-RP-RE-5.0, 2005. (2005).
- Planets of the Solar System (in Russian, 2nd edition) Marov M.. Nauka, Moscow, Russia. (1986).
- SP-100 Power System Conceptual Design for Lunar Base Applications Mason L. et al. NASA TM-102090. (1989).
- Hierarchical Analysis of Options for Lunar-Surface Power Matthews B. et al. Journal of Propulsion and Power, Vol. 10, No. 3. (1994).
- Power Sources for Lunar Bases Mayer A.. Proceedings of SPACE 90, pp. 763-773, ASCE, New York, NY. (1990).
- Fusion, the Energy of the Universe McCracken, G. and Stott, P. Elsevier Academic Press, 2005. (2005).
- Mission and design of the Fusion Ignition Research Experiment (FIRE) Meade, D. M. Proc. 18th IAEA Int. Conf. on Fusion Energy, Sorrento, 2000. (2000).
- Aspect ratio scaling of ideal no-wall stability limits in high bootstrap fraction tokamak plasmas Menard, J. E., Bell, M. G., et al. Physics of Plasmas 11, 639, 2004. (2004).
- Fundamentals of Plasma Physics and Controlled Fusion (revised edn.) Miyamoto, K. National Institute for Fusion Science, 2001. (2001).
- The Aries-I Tokamak Fusion Reactor Study Najmabadi, F., Conn, R. W., et al. Fusion Technology, p. 253, North Holland, 1991. (1991).
- Overview of the ARIES-RS Reverse-Shear Tokamak Power Plant Study Najmabadi, F. and the ARIES Team. Fusion Engineering and Design Vol 38, P. 3, 1997. (1997).
- ARIES-AT: An advanced Tokamak, advanced technology fusion power plant Najmabadi, F., Jardin, S. C. et al. Proc. 18th IAEA Int. Conf. on Fusion Energy, Sorrento, 2000. (2000).
- Lunar Power Systems NASA. NASA CR-171956. (1986).
- Conceptual Design of a Lunar Base Solar Power Plant NASA. NASA CR-172086. (1988).
- Lunar / Mars Exploration Initiative - Conceptual Design of Power Systems NASA. Report No. JSC-24101, NASA, Johnson Space Center, Houston, TX. (1989).
- A Site Selection Strategy for a Lunar Outpost NASA. Solar Systems Exploration Division, NASA, Johnson Space Center, Houston, TX. (1990a).
- Application of Muon-Catalyzed Fusion, and an Alternative Approach for Space Propulsion NASA OSAT Eighth Advanced Space Propulsion Workshop, JPL Internal Document D-15461. (1997).
- Microfission-Powered Orion Rocket NASA JPL/MSFC Thirteenth Annual Advanced Space Propulsion Workshop. (2002).
- US Stellarator program plan National Stellarator Program Planning Committee. Innovative Confinement Concepts Workshop, PPPL, 1998. (1998).
- Solar-Flare Shielding with Regolith at a Lunar Base Site Nealy J. et al. NASA TP-2869. (1988).
- Deep-Space Radiation Exposure Analysis for Solar Cycle XXI (1975-1986) Nealy J. et al. SAE Technical Paper 901347. (1990).
- Flywheel Electronics Nola F.. NASA CP-2290, pp. 105-116. (1983).
- Adiabatic Charged Particle Motion Northrup, T. G. McGraw Hill (Kunkel, W. B. editor), 1966. (1966).
- Power for a Lunar Colony O'Day M.. Proceedings of the Lunar and Planetary Exploration Colloquium. (1958).
- The spherical torus pathway to fusion power Peng, M. Innovative Confinement Concepts Workshop, PPPL, 1998. (1998).
- Near-Term Thermoelectric Nuclear Power Options Peterson J.. NASA, Proceedings of 3rd SEI Technical Interchange, pp. 373-385. (1992).
- Bluebells and Nuclear Energy Reynolds, A. B. Cogito Books, 1996. (1996).
- The Reversed Field Pinch Whitepaper RFP Research Community. Innovative Confinement Concepts Workshop, PPPL, 1998. (1998).
- Plasmas and Controlled Fusion Rose, D. J. and Clark, M. MIT Press, 1961. (1961).
- Learning About Energy Rose, D. J. Plenum Press, 1986. (1986).
- Space Reactor / Stirling Cycle Systems for High Power Lunar Application Schmitz P.; Mason L.. NASA TM-103698. (1991).
- Plasma Equilibrium in a Magnetic Field Shafranov, V. D. Consultants Bureau (Leontovich, ed.) Vol. 2, 1966. (1966).
- Initial Results from the Solar Dynamic (SD) Ground Testing Demonstration (GTD) at NASA Lewis Shaltens R.; Boyle R.. NASA TM-107004. (1995).
- Why magnetized target fusion offers a low-cost development path for fusion energy Siemon, R. E., Lindemuth, I. R., and Schoenberg, K. F. Comments on Plasma Physics and Controlled Fusion 18, 363, 1999. (1999).
- Plasma Confinement in Closed Magnetic Systems Solov'ev, L. S. and Shafranov, V. D. Consultants Bureau (Leontovich, ed.) Vol. 5, 1967. (1967).
- Power Systems for Production, Construction, Life Support, and Operations in Space Sovie R.. NASA TM-100838. (1988).
- Towards the Moon and the Solar System Spaceflight. Spaceflight, Vol. 38, pp. 271-272. (1996).
- US Spherical Torus Fusion Energy Science Research Spherical Torus White Paper. Fusion Summer Study, Snowmass, 1999. (1999).
- The Physics of Fully Ionized Gases (second edn.) Spitzer, L. Interscience, 1962. (1962).
- Fusion Plasma Analysis Stacey, W. M. John Wiley & Sons, 1981. (1981).
- Fusion Plasma Physics Stacey, W. M. Wiley-VCH, 2005. (2005).
- Two-dimensional calculation of tokamak stability Sykes, A. and Wesson, J. A. Nuclear Fusion 14, 645, 1974. (1974).
- Sustainable Energy Tester, J. W., Drake, E. M., Driscoll, M. J., Golay, M. W., and Peters, W. A. MIT Press, 2005. (2005).
- MHD limits to plasma confinement Troyon, F. Plasma Physics and Controlled Fusion 26 (1A), 209, 1984. (1984).
- Modern Batteries: An Introduction to Electrochemical Power Sources Vincent C. et al. Edward Arnold Publishers, London, UK. (1985).
- TOPAZ II System Description Voss S.. Proceedings of SPACE 94, pp. 717-728, ASCE. (1994).
- America the Powerless Waltar, A. E. Cogito Books, 1995. (1995).
- Hydromagnetic stability of tokamaks Wesson, J. A. Nuclear Fusion 18, 87, 1978. (1978).
- Tokamaks (third edn.) Wesson, J. Oxford University Press, 2004. (2004).
- Theory of Toroidally Confined Plasmas White, R. B. Imperial College Press, 2001. (2001).